







Brief Description
This SOP explains the procedure for assigning unique identification numbers to rooms, equipment, and instruments used in different areas of the pharmaceutical facility. Its main purpose is to provide a clear and uniform numbering system so that every room and item can be easily identified, recorded, and controlled. The concerned area Officer/Executive informs the Quality Assurance Department whenever a new room, equipment, or instrument requires an identification number. QA assigns the number, and the Head of Quality Assurance verifies the assigned identification. Different numbering formats are used for Cephalosporin, General Block, Utility, Quality Control, Quality Assurance, Warehouse, and other areas. The identification generally includes the plant or block code, equipment or room code, and a serial number starting from 001. For example, a General Block tablet manufacturing room may be numbered SG/TM/001. This system supports easy identification and proper documentation of facility assets.
1. Flow Diagram:
This SOP describes the procedure for assigning unique identification numbers to rooms, equipment, and instruments used in different areas of a pharmaceutical facility. The purpose is to maintain a uniform numbering system so that every room and equipment item can be easily identified, recorded, and traced. The concerned Officer or Executive informs the Quality Assurance Department whenever a new room, equipment, or instrument requires an identification number. QA assigns the number according to the defined numbering format, and the Head of Quality Assurance verifies the assigned number.
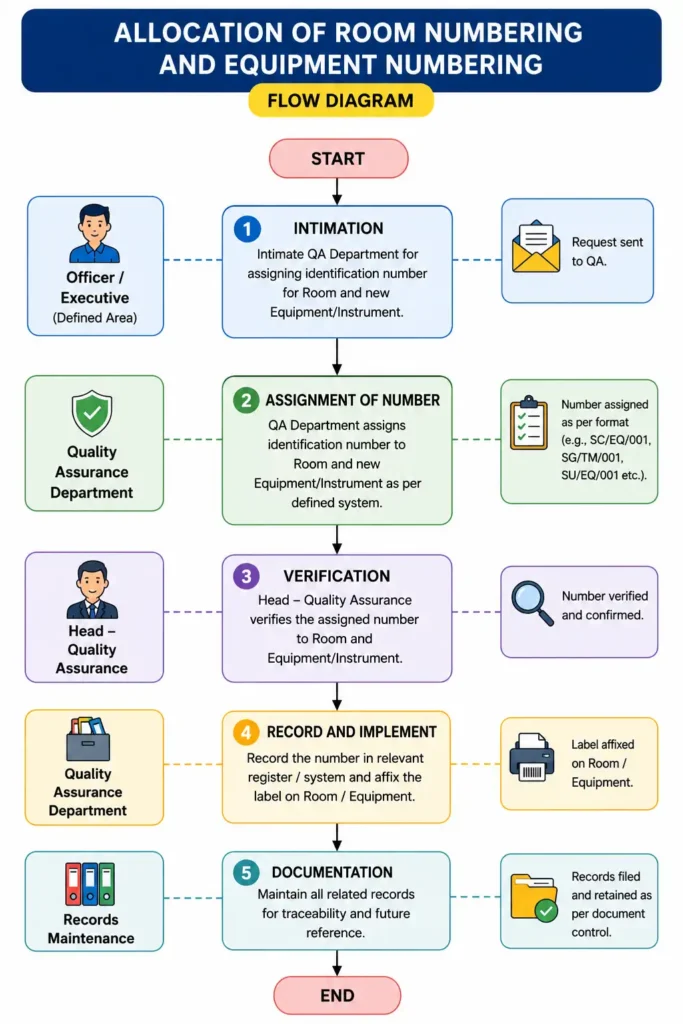
Different codes are used for areas such as General Block, Cephalosporin Block, Utility, Quality Control, Quality Assurance, and Warehouse. Serial numbers generally start from 001. Examples include SG/EQ/001 for equipment and SG/TM/001 for a tablet manufacturing room. This system helps maintain proper identification, documentation, traceability, and control of rooms and equipment.
2. Brainstorming:
Brainstorming is a simple method used to collect ideas from a team before deciding the best way to solve a problem or improve a process. For room and equipment numbering, the team can discuss how to make the identification system clear, simple, unique, and easy to follow.
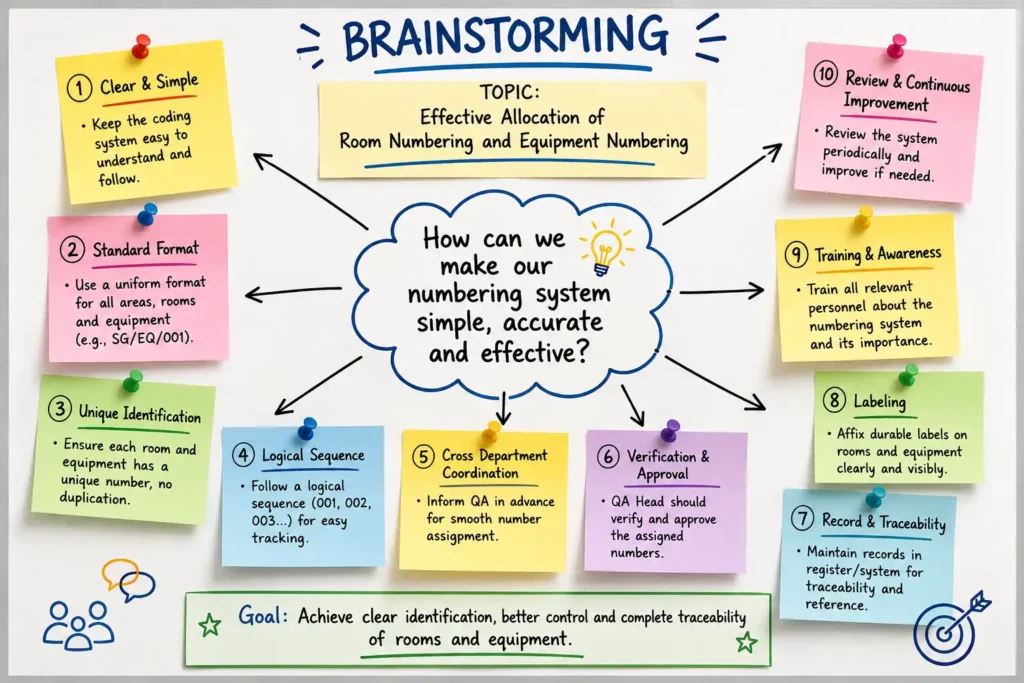
During brainstorming, ideas may include using a standard numbering format, avoiding duplicate numbers, following a logical serial sequence, coordinating with Quality Assurance, verifying assigned numbers, maintaining proper records, fixing clear labels, and training concerned personnel. Team members are encouraged to share ideas freely without immediate criticism.
After collecting all suggestions, the useful ideas are reviewed and selected for implementation. Brainstorming helps identify possible weaknesses in the numbering system and improves control, communication, documentation, and traceability. The final goal is to ensure that every room, equipment, and instrument has a correct and easily traceable identification number.
3. 5-Why Analysis:
5-Why Analysis is a simple root cause analysis method used to understand why a problem happened. In this method, the question “Why?” is asked repeatedly, usually five times, until the main or root cause is identified.
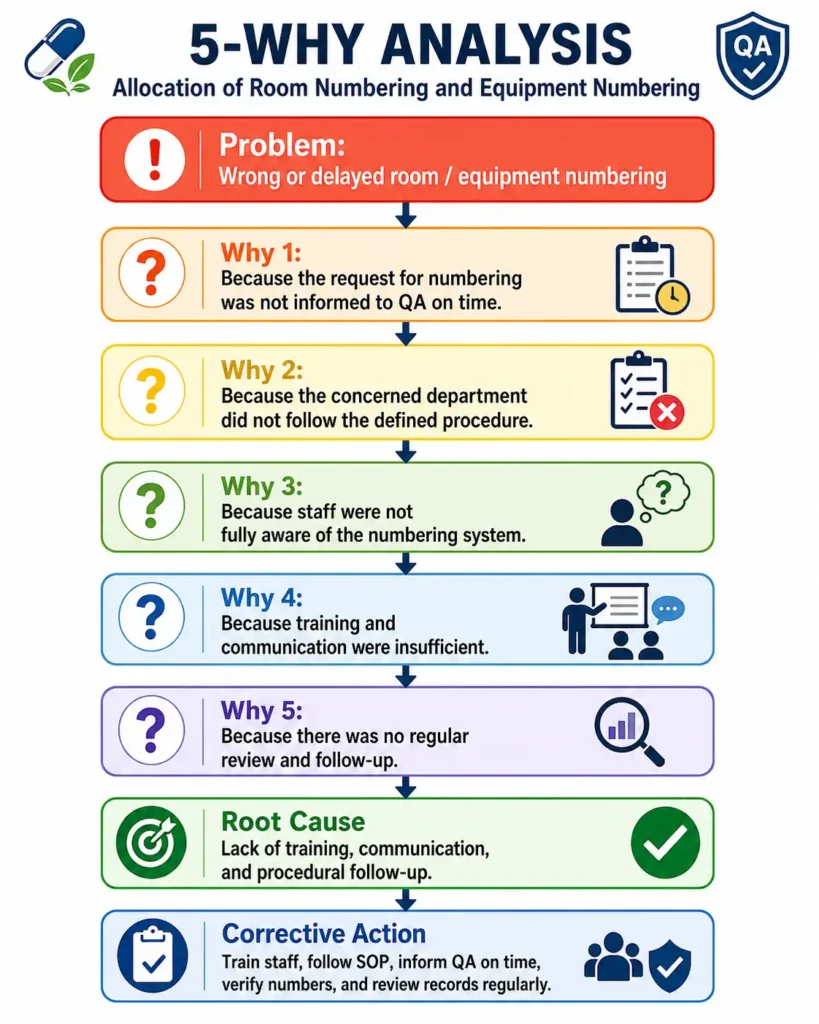
For room and equipment numbering, the problem may be wrong or delayed identification numbering. The first “Why” may show that the request was not sent to Quality Assurance on time. Further questioning may identify that the defined procedure was not followed, employees were not fully aware of the numbering system, training and communication were insufficient, and regular review was not performed. The final root cause can then be identified, such as inadequate training, communication, or procedural follow-up. Corrective actions may include training concerned personnel, following the SOP properly, informing QA on time, verifying assigned numbers, and regularly reviewing numbering records. This method helps prevent recurrence and improves system control.
4. Fishbone Diagram (Ishikawa):
A Fishbone Diagram, also called an Ishikawa Diagram or Cause-and-Effect Diagram, is a simple tool used to identify possible causes of a problem. In room and equipment numbering, the main problem may be wrong, missing, duplicate, or delayed identification numbers.
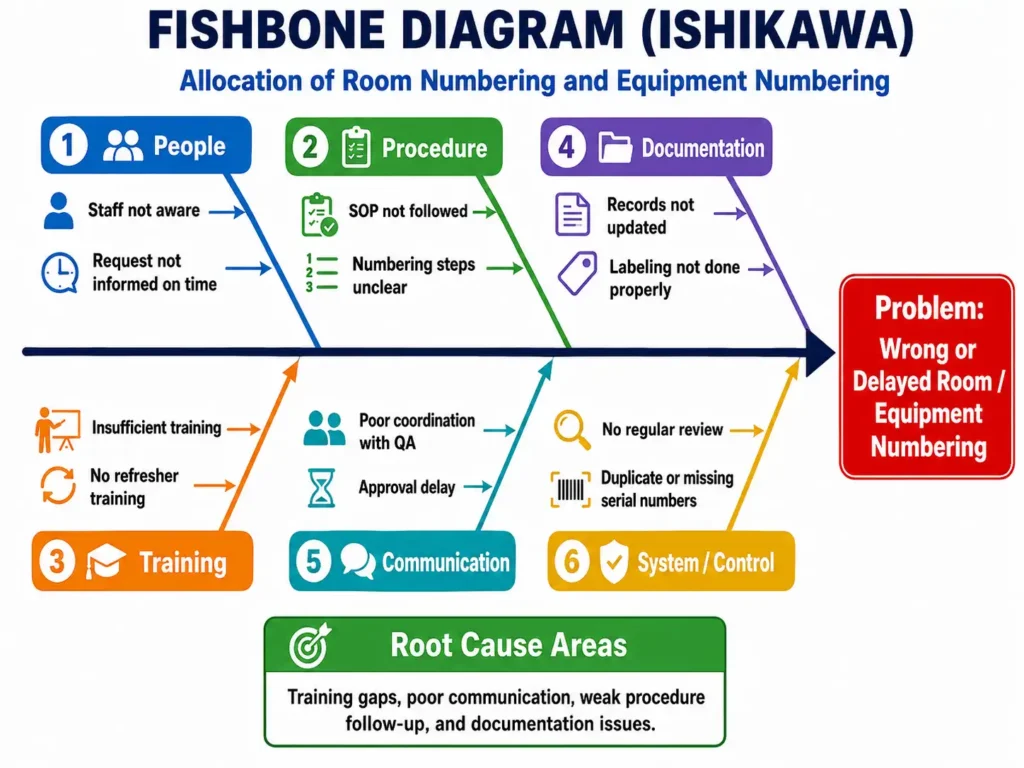
The possible causes are grouped into categories such as People, Procedure, Training, Documentation, Communication, and System/Control. For example, staff may not be aware of the numbering system, the SOP may not be followed properly, training may be insufficient, records may not be updated, coordination with QA may be poor, or regular review may not be performed. By placing all possible causes around the main problem, the team can easily understand where the failure may have occurred. The Fishbone Diagram helps the investigation team identify the most likely root causes and decide suitable corrective and preventive actions to avoid recurrence.
5. Fault Tree Analysis (FTA):
Fault Tree Analysis is a simple investigation tool used to identify different causes that can lead to one main problem. In this case, the top event is incorrect, missing, or duplicate room and equipment numbering.
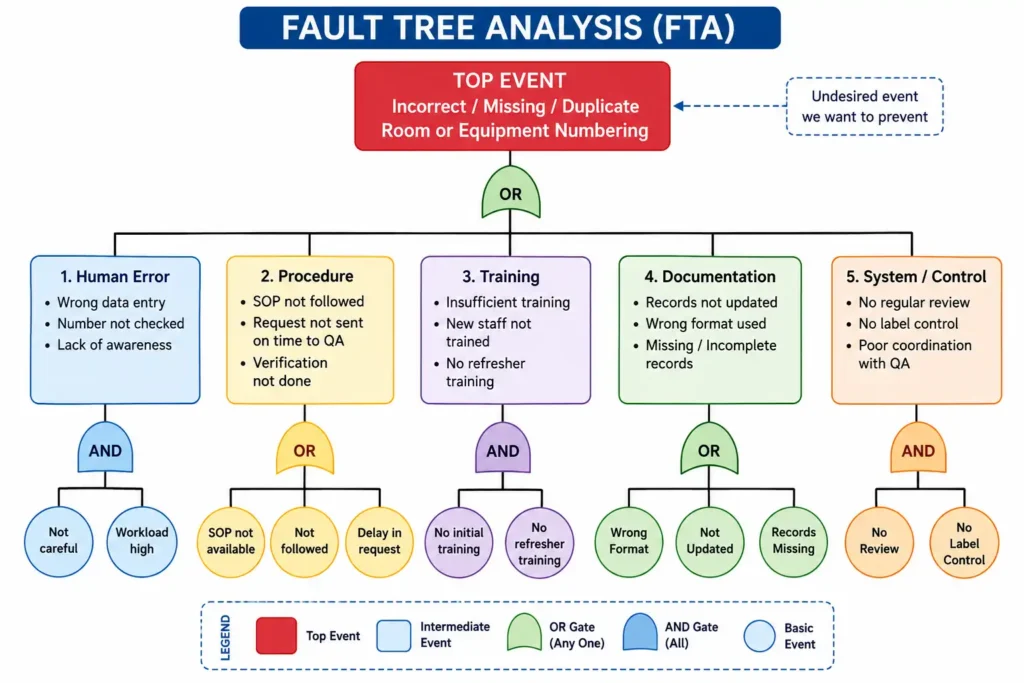
The analysis starts from the main problem and then breaks it into possible cause groups such as Human Error, Procedure, Training, Documentation, and System/Control. Each group is further divided into smaller causes. For example, wrong data entry, SOP not followed, insufficient training, incomplete records, or lack of regular review may contribute to the problem. FTA uses AND and OR gates to show how different causes are connected. An OR gate means any one cause may lead to the problem, while an AND gate means several causes may need to occur together. This method helps the QA team understand failure paths, identify root causes, and select suitable corrective and preventive actions.
6. Failure Mode and Effects Analysis (FMEA):
Failure Mode and Effects Analysis (FMEA) is a simple risk assessment tool used to identify what can go wrong in a process, what effect it may have, and how the risk can be controlled.
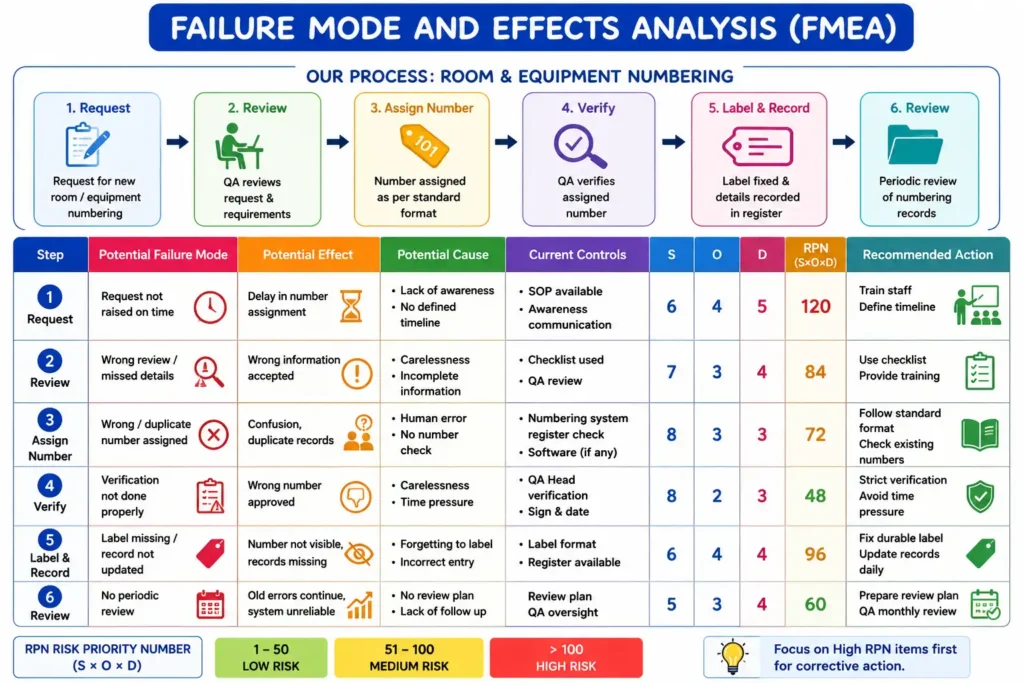
For room and equipment numbering, possible failures may include delayed numbering requests, wrong or duplicate numbers, incomplete verification, missing labels, incorrect records, or lack of periodic review. Each failure is evaluated based on Severity (S), Occurrence (O), and Detection (D).
The Risk Priority Number (RPN) is calculated as:
RPN = Severity × Occurrence × Detection
Higher RPN values indicate higher risk and require priority action. Suitable actions may include staff training, following the approved numbering format, checking existing numbers, proper QA verification, updating registers, fixing clear labels, and performing regular review. FMEA helps reduce errors, improve traceability, strengthen documentation, and prevent numbering-related problems before they affect the system.
7. Is / Is-Not Analysis:
Is / Is-Not Analysis is a simple problem-solving tool used to clearly understand where a problem exists and where it does not exist. It helps the investigation team separate known facts from gaps or abnormal conditions.
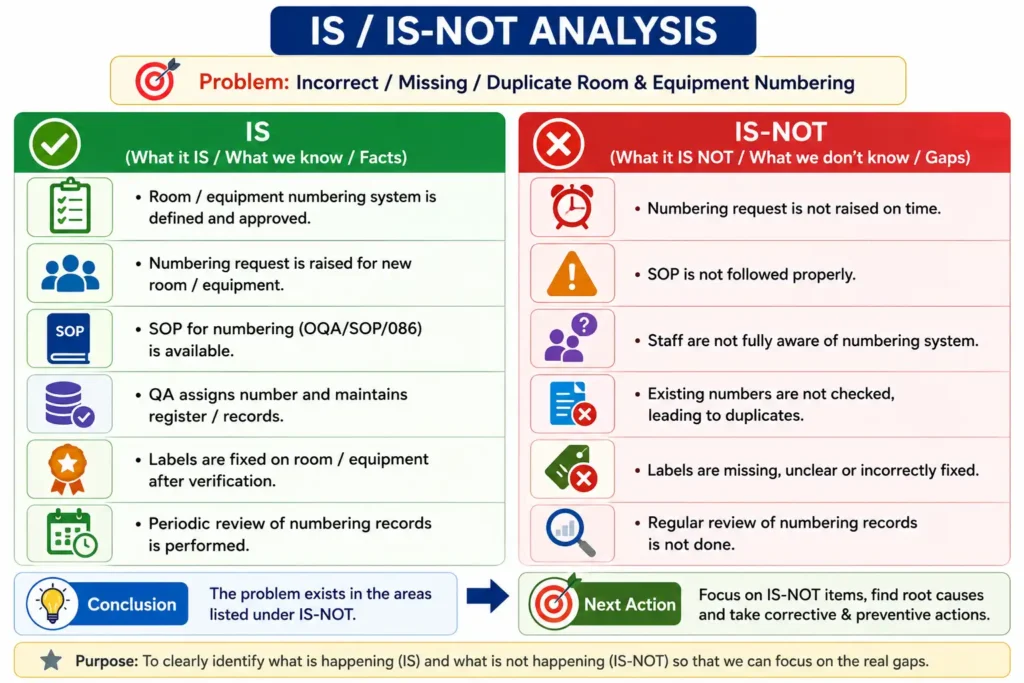
For room and equipment numbering, the “IS” side may include facts such as an approved numbering system, an available SOP, QA responsibility for assigning numbers, proper labeling, and maintenance of records. The “IS-NOT” side may include delayed requests, SOP not followed correctly, lack of staff awareness, duplicate numbers, missing or unclear labels, and absence of regular record review. By comparing the two sides, the team can focus on the actual problem areas instead of making assumptions. This method helps narrow down possible causes, identify the real gap, and select suitable corrective and preventive actions to improve control and traceability.
8. Pareto Chart:
A Pareto Chart is a simple problem-solving tool used to identify the most important causes of a problem. It combines bars and a cumulative percentage line to show which causes contribute the most.
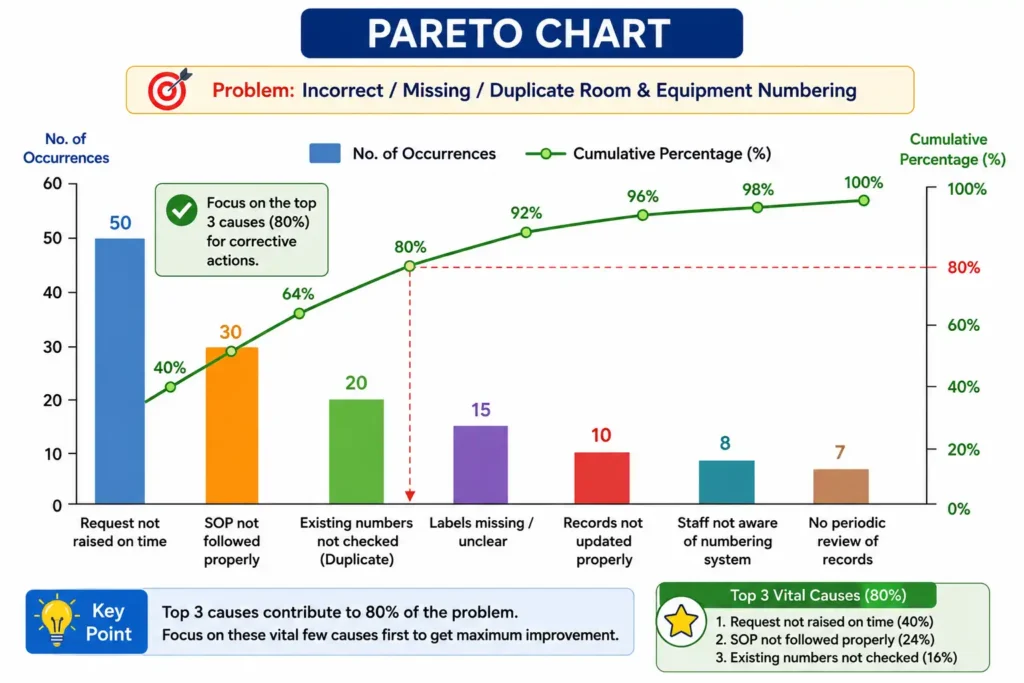
For room and equipment numbering, common causes may include late numbering requests, SOP not followed properly, existing numbers not checked, missing labels, records not updated, lack of staff awareness, and no periodic review. The causes are arranged from the highest occurrence to the lowest. The chart follows the 80/20 principle, which means that a small number of major causes may create most of the problems. By focusing first on the top causes, the organization can achieve faster and more effective improvement. Pareto analysis helps the QA team prioritize corrective actions, reduce repeated errors, improve numbering control, and strengthen documentation and traceability.
9. Timeline Analysis
Timeline Analysis is a simple investigation tool used to arrange events in the exact sequence in which they occurred. It helps the team understand when a problem started, what happened before it, and where any delay or mistake occurred.
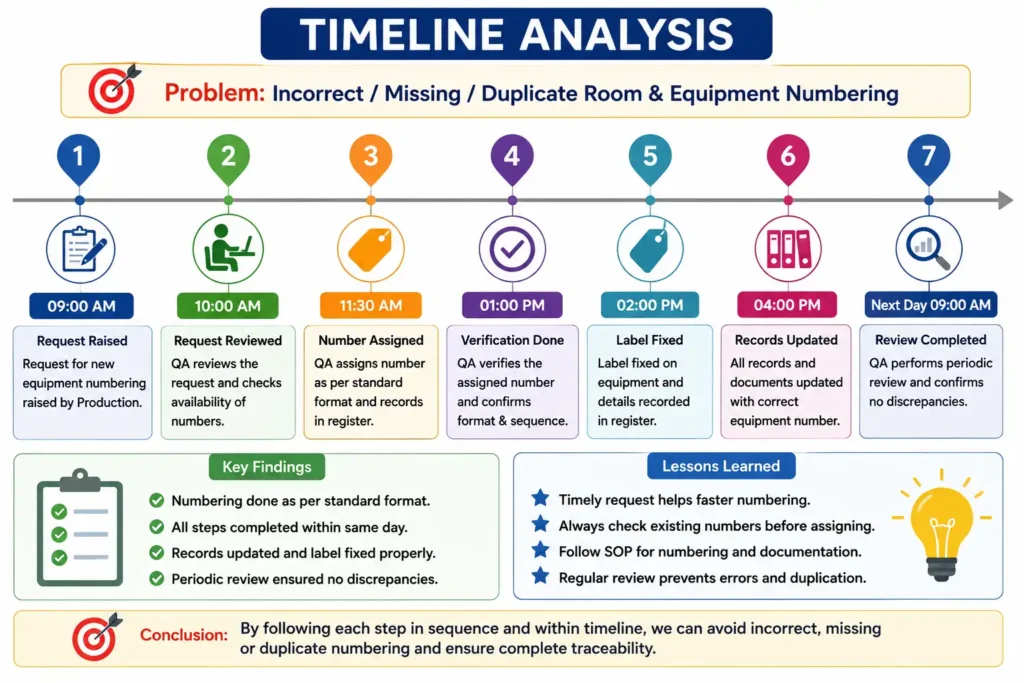
For room and equipment numbering, the timeline may include steps such as request raised, QA review, number assigned, verification, label fixing, record updating, and periodic review. By checking each activity with its date and time, the team can identify delays, missed steps, incorrect sequencing, or failures in communication. This method makes the investigation easy to understand because all events are shown in chronological order. It also helps compare what actually happened with what should have happened as per the SOP. Timeline Analysis supports identification of the likely root cause, improves accountability, and helps define suitable corrective and preventive actions to avoid recurrence.
10. Barrier Analysis:
Barrier Analysis is a simple investigation and risk-control tool used to identify the controls that should prevent a problem and to check whether those controls are working effectively.
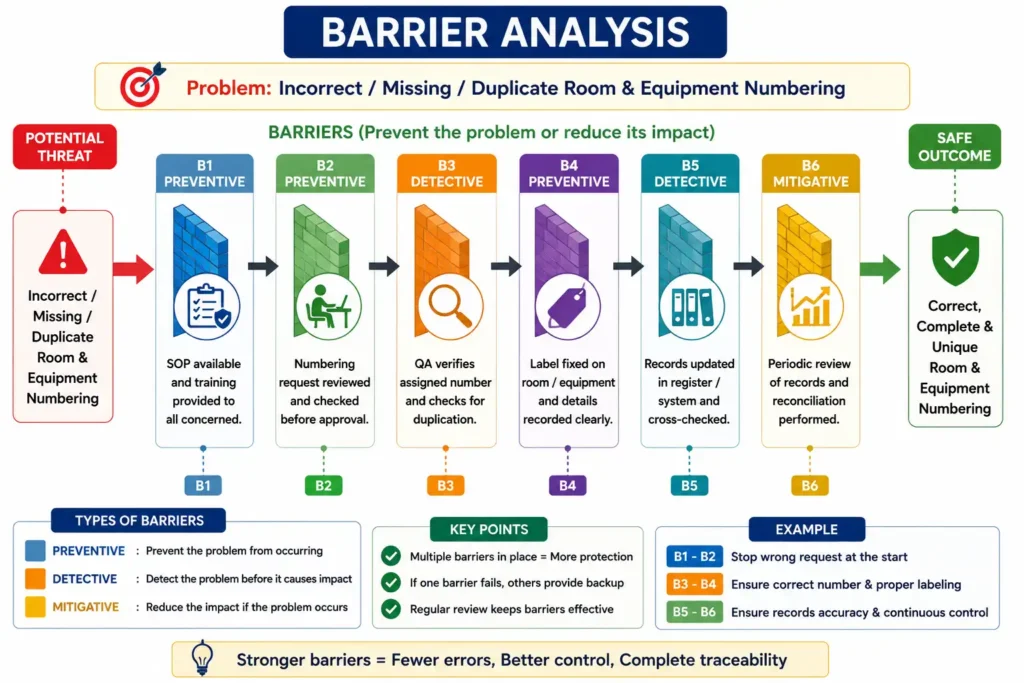
For room and equipment numbering, possible barriers may include an approved SOP, staff training, review of numbering requests, QA verification, checking for duplicate numbers, proper labeling, record updating, and periodic review. These barriers can be preventive, detective, or mitigative. If one barrier is weak or fails, another barrier should help detect or reduce the problem. For example, even if an incorrect number is assigned, QA verification or record checking may identify the error before final use. Barrier Analysis helps the investigation team understand where controls failed, strengthen weak barriers, and introduce additional controls where necessary. Strong barriers reduce numbering errors, improve documentation, and ensure better traceability.
11. Human Error Analysis:
Human Error Analysis is a simple investigation tool used to understand how and why a person-related error occurred during a process. It does not only identify who made the mistake; it also looks at the conditions that contributed to the error.
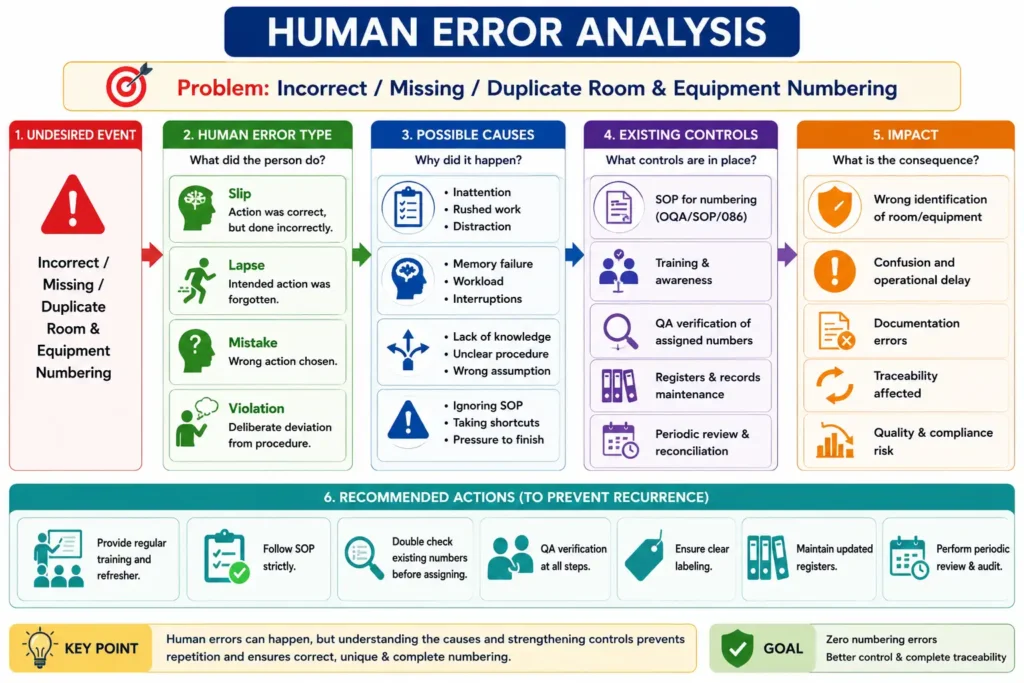
In room and equipment numbering, human errors may include slips, lapses, mistakes, or violations. Possible causes can be lack of attention, high workload, memory failure, interruptions, unclear procedures, lack of knowledge, time pressure, or not following the SOP. The analysis also checks existing controls such as training, QA verification, numbering registers, labeling, and periodic review. Based on the findings, suitable actions may include refresher training, strict SOP compliance, double-checking existing numbers, proper verification, maintaining updated records, and regular audits.Human Error Analysis helps prevent repeated mistakes and improves accuracy, control, documentation, and traceability.