






Brief Description
The SOP for Column Performance describes the standardized procedure used by the Quality Control department to evaluate the performance and suitability of a chromatographic column before or during analytical use. The procedure specifies preparation of a mobile phase consisting of 80 mL methanol and 20 mL water, filtered through a 0.45 µm filter. Chromatographic conditions include detection at 254 nm, a flow rate of 1.0 mL/minute, ambient temperature, and an injection volume of 20 µL. A diluted toluene solution is used as the sample preparation, followed by injection of a blank and five sample preparations.Column performance is assessed using system-suitability parameters including RSD of peak area NMT 1.5%, RSD of retention time NMT 1.0%, USP tailing factor NMT 2, and theoretical plates NLT 10,000, while columns of 50 mm or less require NLT 2,000. Separate annexures are provided for documenting these column-performance results.
Skip to PDF content1. Flow Diagram:
The flow diagram presents the complete procedure for evaluating chromatographic column performance in a simple stepwise sequence. It starts with preparation of the mobile phase using 80 mL methanol and 20 mL water, followed by filtration through a 0.45 µm filter. The chromatographic conditions are then set at 254 nm wavelength, 1.0 mL/min flow rate, ambient temperature, and 20 µL injection volume.
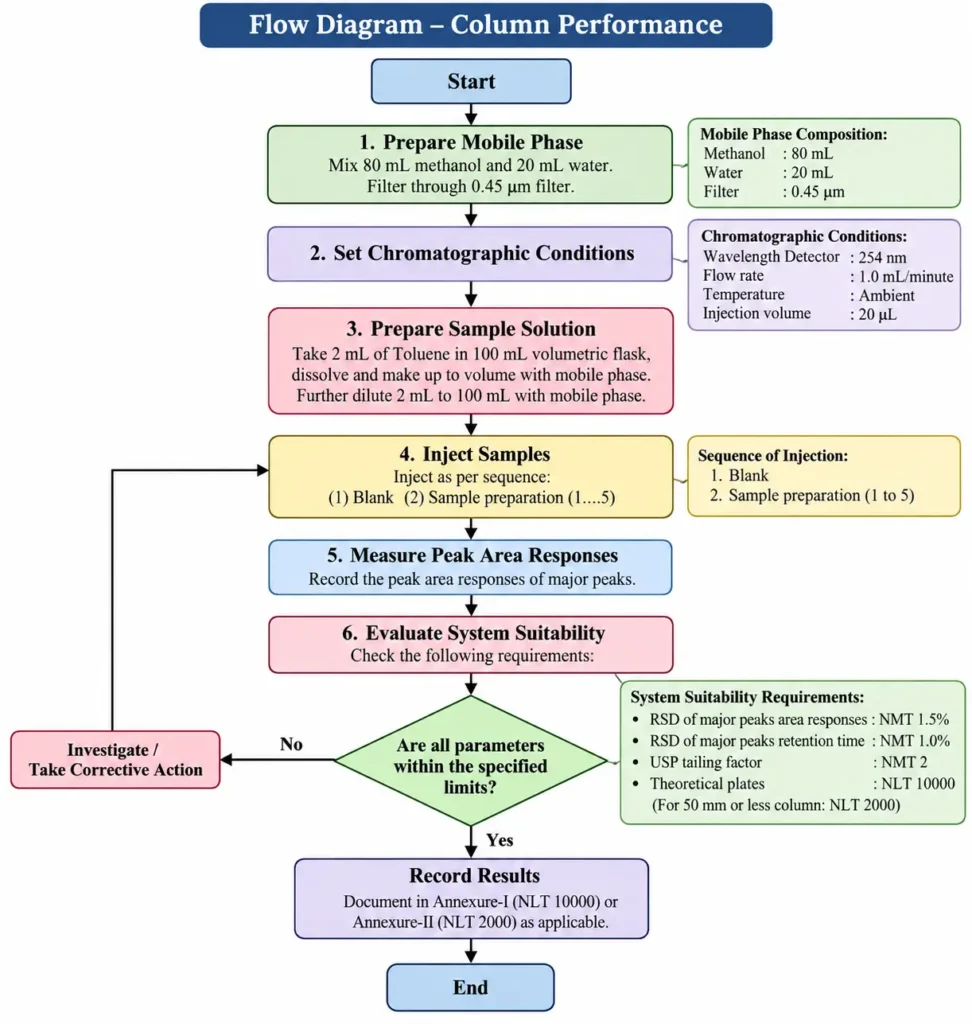
Next, the toluene sample solution is prepared and injected according to the defined sequence of blank followed by five sample preparations. Peak area responses are measured and system suitability is evaluated. Acceptance criteria include RSD of peak area NMT 1.5%, RSD of retention time NMT 1.0%, USP tailing factor NMT 2, and theoretical plates NLT 10,000 or NLT 2,000 for columns of 50 mm or less.If all parameters comply, the results are recorded in the applicable column performance record. If any parameter fails, investigation and corrective action are initiated before repeating the evaluation.
2. Brainstorming for SOP Failure:
The brainstorming diagram provides a structured visual approach to identifying potential causes of failure in the Column Performance SOP. It groups possible issues into key areas such as mobile phase and reagents, instrument parameters, sample handling, data and results, chromatographic performance, equipment and maintenance, personnel training, and documentation oversight.
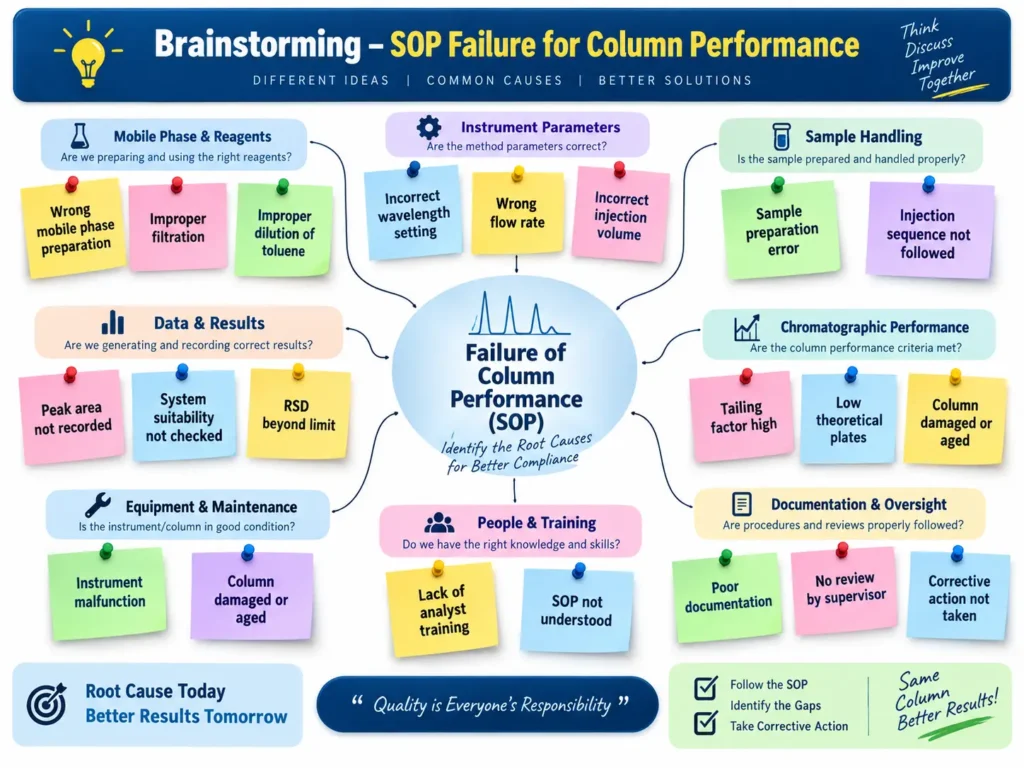
Potential causes highlighted include incorrect mobile phase preparation, improper filtration or dilution, wrong wavelength or flow rate, incorrect injection volume, sample preparation errors, failure to follow the injection sequence, inadequate system-suitability checks, excessive RSD, high tailing factor, low theoretical plates, damaged or aged columns, instrument malfunction, insufficient analyst training, poor documentation, lack of supervisory review, and failure to initiate corrective action. The SOP itself specifies the chromatographic settings and system-suitability requirements that these brainstorming points are intended to protect.The sticky-note banner format encourages team discussion, root-cause identification, and selection of appropriate CAPA to prevent recurrence and improve consistent compliance with the SOP.
3. 5-Why Analysis for SOP Failure:
The 5-Why Analysis diagram is designed to identify the underlying cause of failure in the Column Performance SOP by repeatedly asking why the expected chromatographic results were not achieved. The analysis begins with an out-of-specification column performance result and then traces the problem through failure of system suitability parameters such as RSD, tailing factor, and theoretical plates. The SOP requires RSD of peak area NMT 1.5%, RSD of retention time NMT 1.0%, USP tailing factor NMT 2, and theoretical plates within specified limits.
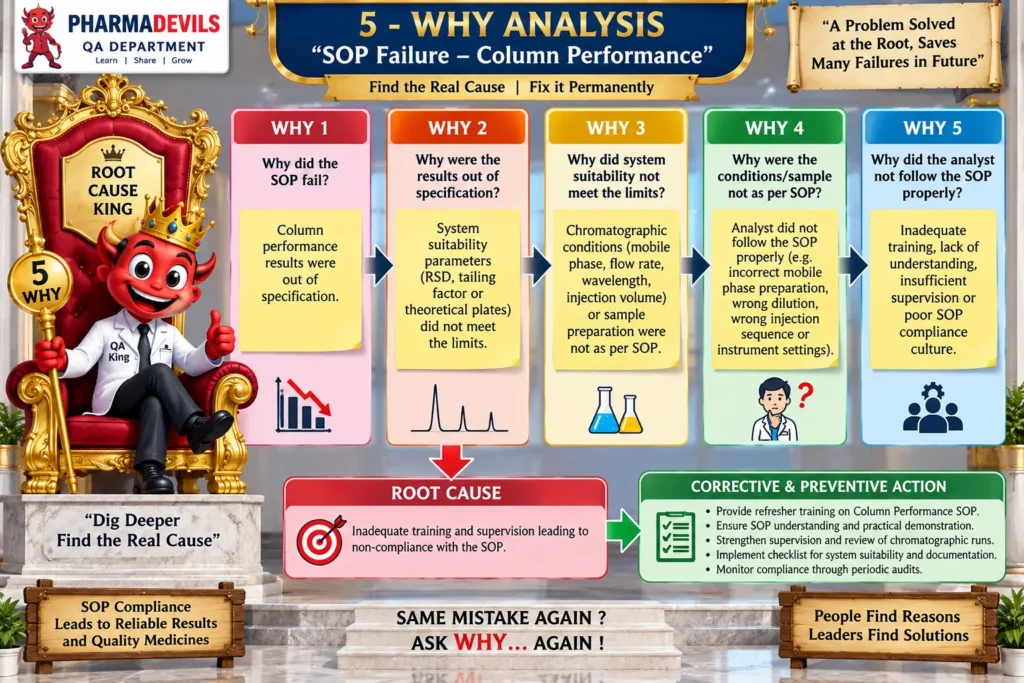
Further questioning focuses on deviations in chromatographic conditions, mobile phase preparation, sample dilution, injection sequence, or analyst execution. The final root cause may relate to inadequate training, insufficient supervision, poor SOP understanding, or weak procedural compliance. The diagram also emphasizes corrective and preventive actions such as refresher training, practical demonstration, stronger supervisory review, checklist implementation, and periodic monitoring to prevent recurrence.
4. Fishbone Analysis for SOP Failure:
The Fishbone Analysis diagram provides a structured root-cause evaluation for failure of the Column Performance SOP. The tree-style diagram groups potential causes into six major categories: Method, Machine/Instrument, Material/Column, Measurement/Results, Man/Training, and Documentation/Control. Possible causes include incorrect mobile phase preparation, improper filtration, wrong wavelength or flow rate, incorrect injection volume, damaged or aged columns, unsuitable reagents, analyst training gaps, poor documentation, and inadequate system-suitability review.
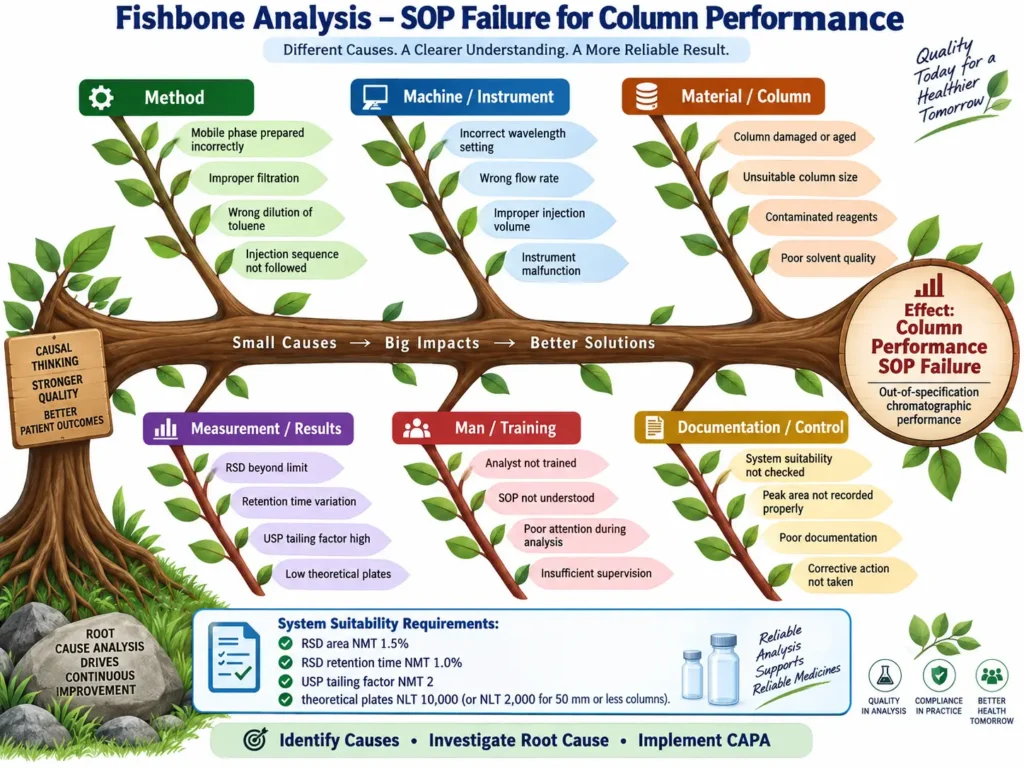
The analysis focuses on identifying factors that may lead to unacceptable chromatographic performance such as excessive RSD, high USP tailing factor, retention-time variation, or low theoretical plates. The SOP defines chromatographic conditions and acceptance criteria including RSD area NMT 1.5%, RSD retention time NMT 1.0%, USP tailing factor NMT 2, and specified theoretical plate requirements.This diagram supports systematic investigation, root-cause identification, and appropriate CAPA to prevent recurrence.
5. Fault Tree Analysis for SOP Failure:
Fault Tree Analysis (FTA) for failure of the SOP for Column Performance is a systematic method used to identify the possible causes that can lead to unsuccessful or unreliable column performance testing. The top event is defined as “SOP Failure/Column Performance Test Failure.” Major contributing branches may include incorrect mobile-phase preparation, deviation from specified chromatographic conditions, improper sample preparation, incorrect injection sequence, instrument or column-related problems, failure to verify system suitability, and documentation or personnel errors. The SOP specifies methanol–water mobile phase, 254 nm detection, 1.0 mL/min flow rate, 20 µL injection volume, defined sample preparation, and a blank followed by five sample injections.
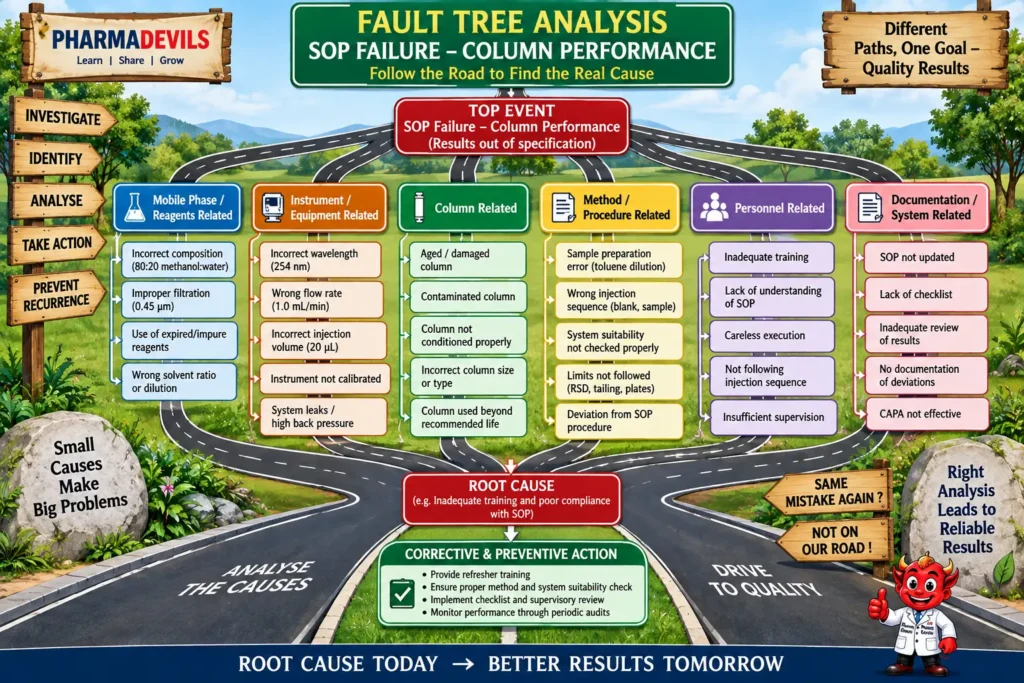
FTA also considers failure to meet acceptance criteria such as peak-area RSD NMT 1.5%, retention-time RSD NMT 1.0%, USP tailing NMT 2, and specified theoretical-plate requirements. Identifying these root and contributing causes supports appropriate CAPA, retraining, equipment checks, and improved SOP compliance.
Questions & Answers – SOP for Column Performance
- Q: What is the objective of the Column Performance SOP?
A: To lay down a defined procedure for evaluating column performance. - Q: Who is responsible for executing the SOP?
A: The Executive-QC is responsible for execution, while the Manager-QC and Head QC/QA are responsible for effective implementation. - Q: What mobile phase is used for column performance testing?
A: A mixture of 80 mL methanol and 20 mL water, filtered through a 0.45 µm filter. - Q: What wavelength is specified for detection?
A: 254 nm. - Q: What is the specified flow rate?
A: 1.0 mL/minute. - Q: What injection volume is specified?
A: 20 µL. - Q: How is the sample preparation performed?
A: Take 2 mL of toluene in a 100 mL volumetric flask and make up the volume with mobile phase. Further dilute 2 mL of this solution to 100 mL with mobile phase. - Q: What is the injection sequence?
A: First inject the blank, followed by the sample preparation five times. - Q: What is the acceptance limit for RSD of peak-area responses?
A: NMT 1.5%. - Q: What is the acceptance limit for RSD of retention time?
A: NMT 1.0%. - Q: What is the acceptance criterion for USP tailing factor?
A: NMT 2. - Q: What is the theoretical plate requirement?
A: The SOP specifies NLT 10,000 theoretical plates, except for columns of 50 mm or less, where NLT 2,000 is specified. - Q: What parameters are recorded in the Column Performance Record?
A: RSD responses, RSD retention time, USP tailing factor, and theoretical plates are recorded along with results and remarks. - Q: What can indicate failure of column performance?
A: Failure occurs when the recorded system-suitability results do not comply with the limits defined in the SOP, such as excessive RSD or tailing, or insufficient theoretical plates. - Q: What should be checked when column performance fails?
A: The SOP itself does not provide a separate failure-investigation procedure; it specifies the chromatographic conditions, sample preparation, injection sequence, and system-suitability requirements that should be verified during assessment.
Reference Guidelines:
- USP–NF General Chapter <621> – Chromatography
Provides chromatographic terminology, calculations, column-performance concepts, and general system suitability requirements applicable to HPLC procedures. (USP)
USP <621> Chromatography - European Pharmacopoeia General Chapter 2.2.46 – Chromatographic Separation Techniques
Covers chromatographic performance and system-suitability requirements for LC and GC procedures. (EDQM)
EDQM – Chromatographic Separation Techniques - ICH Q2(R2) – Validation of Analytical Procedures
Applicable for demonstrating that analytical procedures are fit for their intended purpose, including evaluation of performance characteristics such as precision, accuracy, specificity and range. (ICH Database)
ICH Q2(R2) Guideline - ICH Q14 – Analytical Procedure Development
Provides lifecycle-based guidance for analytical procedure development, parameter understanding, robustness, control strategy and continual improvement. (ICH)