





Brief Description
This SOP describes the procedure for performing the Microbial Limit Test of raw water and purified water in the Quality Control microbiology laboratory. Its purpose is to determine the microbial quality of water through Total Aerobic Viable Count (TAVC) and testing for specified microorganisms. The microbiologist is responsible for execution of the procedure, while QC and QA/QC management ensure effective implementation. For total viable count, water samples are handled aseptically under a qualified LAF, inoculated in duplicate plates, mixed with sterilized R2A agar, and incubated at 30–35°C for 5 days. Colony counts are averaged and reported as CFU/ml. The SOP also includes testing for E. coli, Salmonella, Pseudomonas aeruginosa, and Staphylococcus aureus using selective enrichment media and appropriate incubation conditions. Positive and negative controls are included, and suspected growth is confirmed by biochemical testing. Annexures provide formats for recording the microbiological analysis of both purified and raw water.
Skip to PDF content1. Flow Diagram:
The flow diagram explains the Microbial Limit Test for Raw Water and Purified Water in a simple, student-friendly sequence. The process begins with collection of the water sample, followed by cleaning the sample bottle with 70% IPA, transfer through the pass box, and checking the LAF conditions before testing.
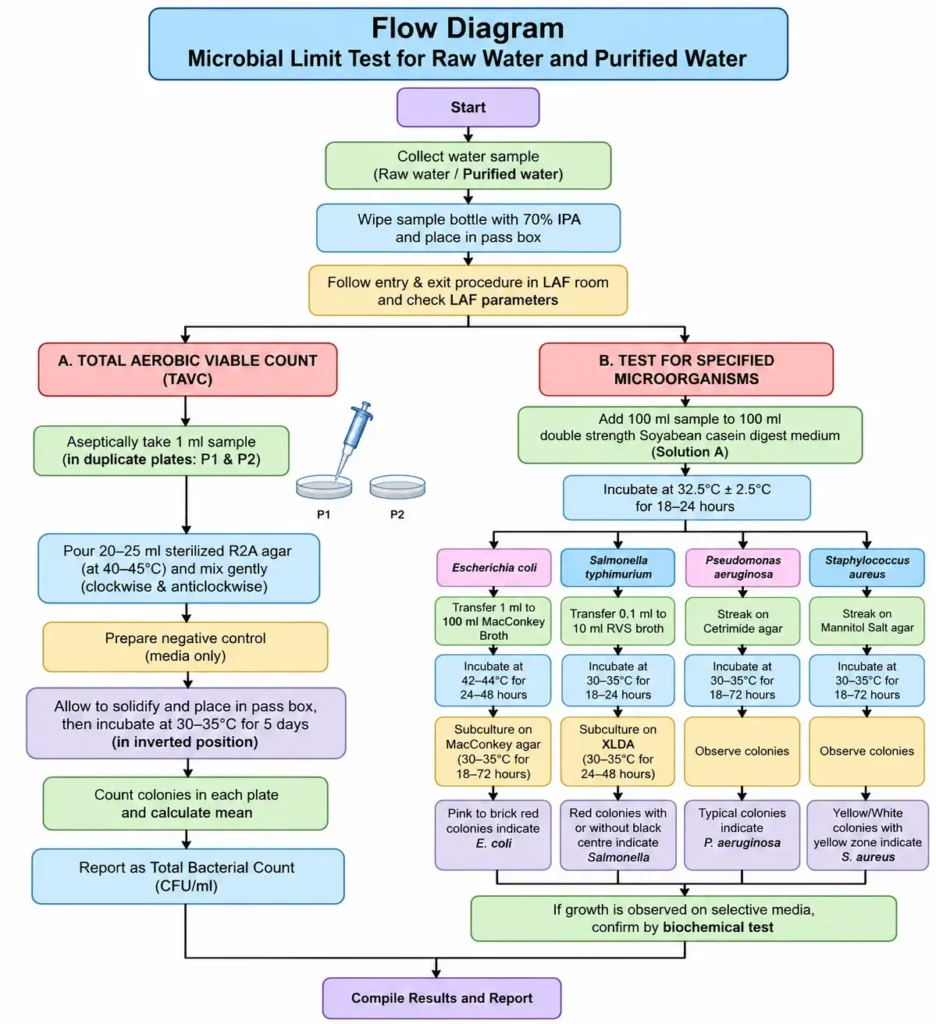
The procedure then divides into two main parts. In the Total Aerobic Viable Count, 1 ml of sample is tested in duplicate plates using sterilized R2A agar, incubated at 30–35°C for 5 days, and colonies are counted to calculate the result in CFU/ml.The second part tests for specified microorganisms such as E. coli, Salmonella, Pseudomonas aeruginosa, and Staphylococcus aureus using selective media and suitable incubation conditions. Suspected growth on selective media is confirmed by biochemical testing before final reporting.
2. Brainstorming for SOP Failure:
The brainstorming diagram presents possible reasons for SOP failure in a pharmaceutical environment using a pharma-company gate theme. The central problem, “SOP Failure,” is surrounded by different potential contributing factors so that the team can discuss and identify the most likely causes.
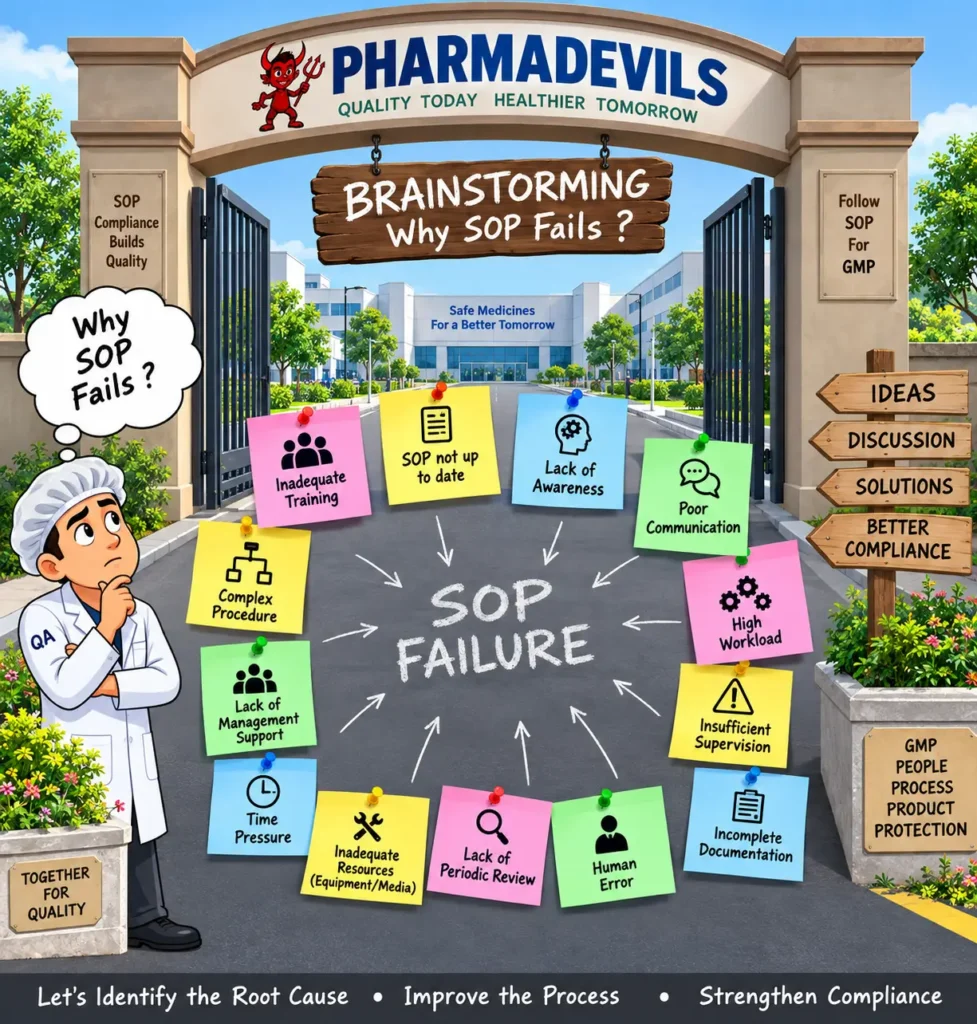
Key brainstorming points include inadequate training, outdated SOPs, lack of awareness, poor communication, complex procedures, high workload, insufficient supervision, incomplete documentation, human error, time pressure, inadequate resources, lack of periodic review, and weak management support.The diagram encourages a structured team discussion involving QA, QC, Production, and other concerned departments. By collecting multiple ideas before selecting the root cause, the organization can avoid jumping to conclusions and can develop more effective corrective and preventive actions. The overall purpose is to identify root causes, improve the process, strengthen GMP compliance, and prevent recurrence of SOP failures.
3. 5 Why Analysis for SOP Failure:
The 5 Why diagram shows a root cause analysis of SOP failure using a pharmaceutical company tree concept. The problem, “SOP Failure,” is placed at the center of the tree, while each “Why” explores a deeper reason behind the failure.The analysis begins with the procedure not being followed. It then examines why the operator may not have understood the SOP fully, why training was inadequate or ineffective, and why training needs were not properly assessed or refreshed. The final “Why” identifies a weak system for periodic review, supervision, and compliance monitoring.
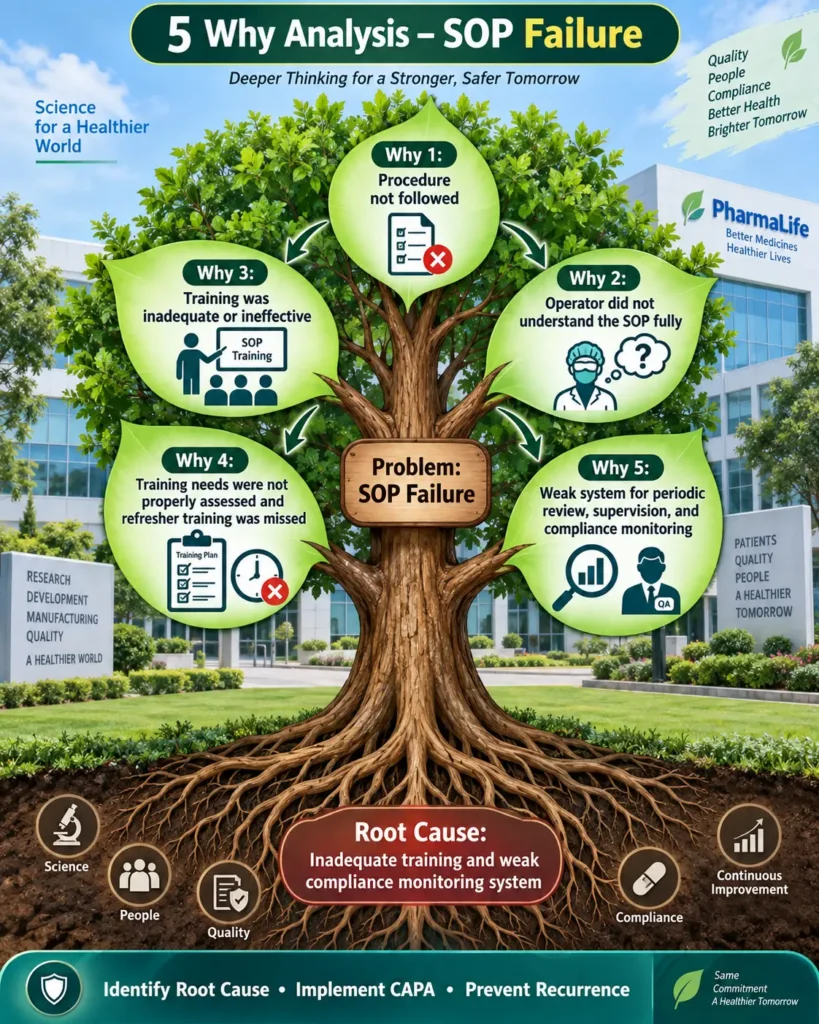
The roots of the tree represent the underlying root cause, highlighting inadequate training and weak compliance monitoring as major contributors. The diagram demonstrates how repeatedly asking “Why?” helps move from the visible problem to the real systemic cause. It supports effective CAPA implementation, stronger training, better supervision, improved SOP compliance, and prevention of recurrence.
4. Fishbone Analysis for SOP Failure:
The Fishbone Analysis diagram presents a structured root cause analysis for SOP failure in a pharmaceutical environment. The main problem, “SOP Failure,” is shown at the head of the fishbone, while possible causes are grouped into major categories to support systematic investigation.
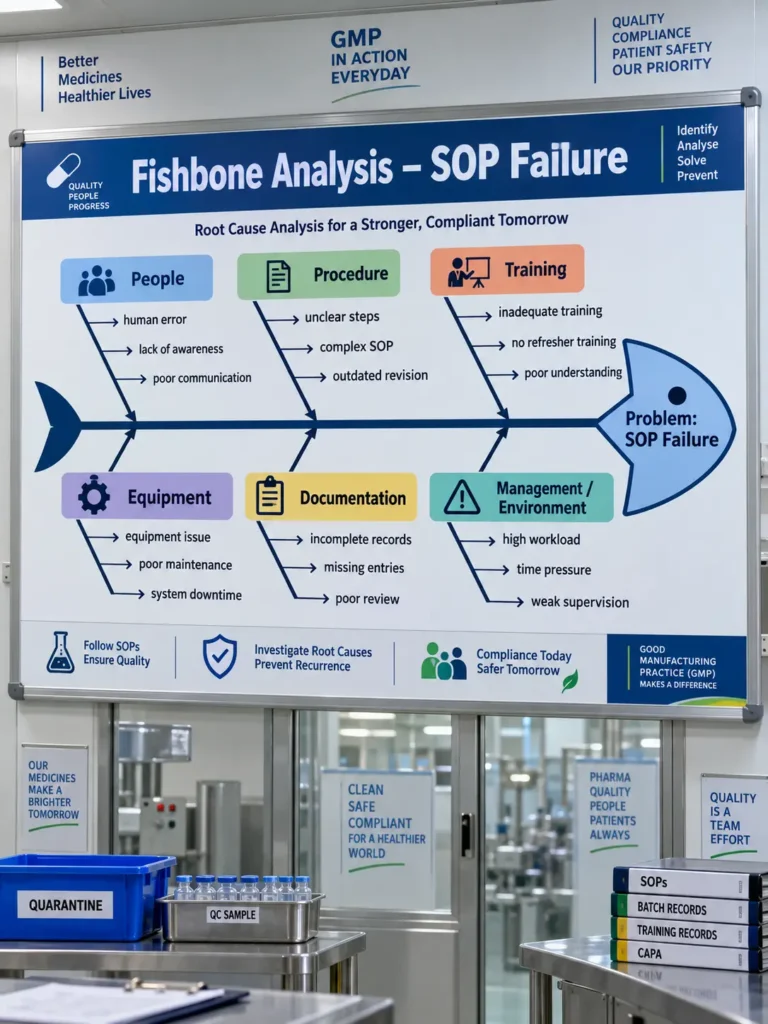
The diagram highlights six key areas: People, Procedure, Training, Equipment, Documentation, and Management/Environment. Typical causes include human error, lack of awareness, poor communication, unclear or outdated SOP steps, inadequate or missing refresher training, equipment problems, poor maintenance, incomplete records, missing entries, high workload, time pressure, and weak supervision.This visual approach helps QA and operational teams examine multiple contributing factors instead of focusing on a single cause. It supports effective root cause identification, CAPA planning, SOP improvement, stronger GMP compliance, and prevention of recurrence.
5. Fault Tree Analysis for SOP Failure:
The Fault Tree Analysis diagram shows a systematic method for identifying the possible causes of SOP failure in a pharmaceutical manufacturing area. The top event, “SOP Failure,” is divided into major contributing conditions such as SOP not followed, SOP unavailable or outdated, and ineffective implementation.
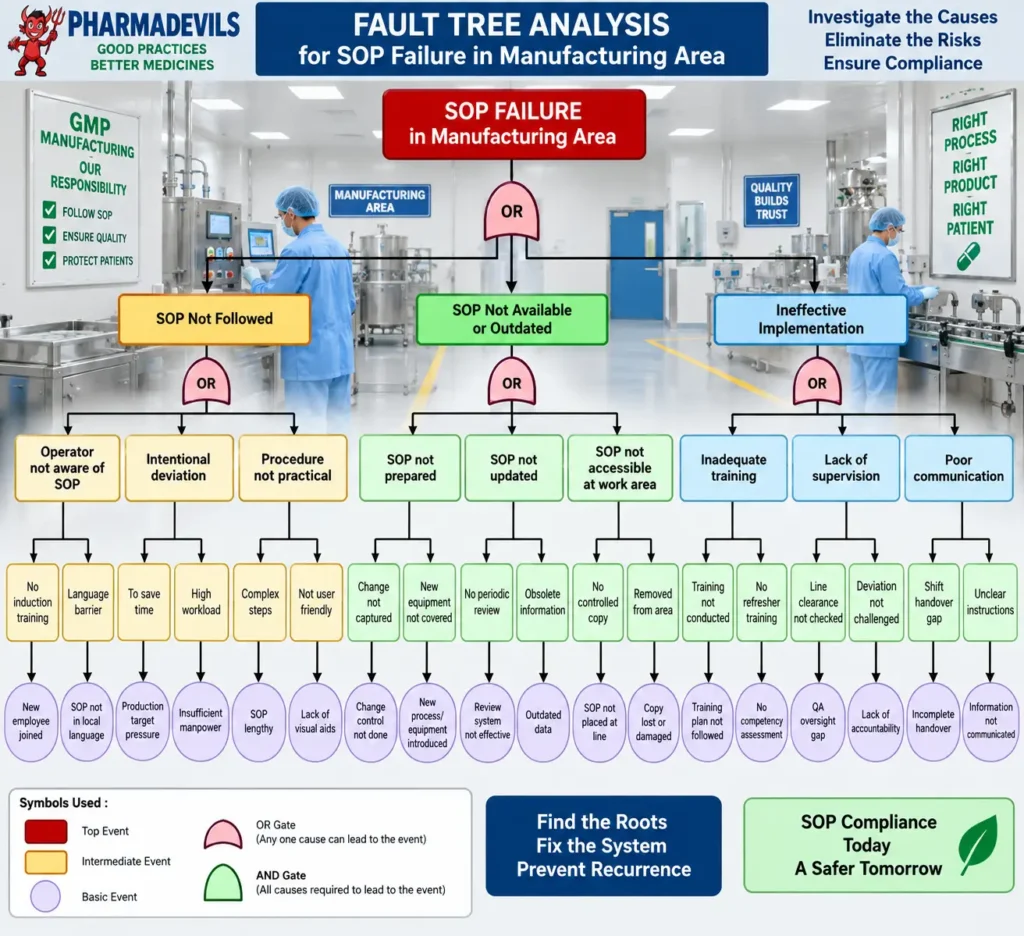
These conditions are further broken down into basic causes including lack of operator awareness, intentional deviation, impractical procedures, missing or outdated SOPs, poor document accessibility, inadequate training, weak supervision, and communication gaps. The diagram uses OR gates to show that any one of several causes may contribute to the failure.By tracing the problem from the top event down to its basic causes, the analysis helps the investigation team identify system weaknesses and prioritize appropriate corrective and preventive actions. It supports better SOP control, stronger training, improved supervision, effective communication, GMP compliance, and prevention of recurrence.
Questions & Answers – Microbial Limit Test for Raw Water and Purified Water
- What is the objective of this SOP?
The objective is to describe the procedure for performing the microbial limit test for raw water and purified water. - Who is responsible for performing the microbial limit test?
The Microbiologist is responsible for executing the SOP, while the Lab Manager QA, Manager-QC, and Head-QA/QC are responsible for effective implementation. - Which medium is used for Total Aerobic Viable Count?
Sterilized R2A Agar is used for the Total Aerobic Viable Count test. - How much sample is taken for the pour plate method?
1 ml of sample is taken aseptically and transferred into duplicate sterile Petri plates, identified as P1 and P2. - How much R2A agar is added to each plate?
Approximately 20–25 ml of sterilized R2A agar maintained at 40–45°C is poured into the plates. - What are the incubation conditions for Total Aerobic Viable Count?
Plates are incubated in an inverted position at 30–35°C for 5 days. - How is the Total Bacterial Count calculated?
The colonies on Plate 1 and Plate 2 are added and divided by two to obtain the average result in CFU/ml. - Which specified microorganisms are tested according to the SOP?
The SOP includes testing for Escherichia coli, Salmonella typhimurium, Pseudomonas aeruginosa, and Staphylococcus aureus. - Which medium is used for enrichment before pathogen testing?
The sample is added to pre-incubated double-strength Soyabean Casein Digest Medium and incubated before further testing. - Which medium is used for E. coli testing?
The enriched sample is transferred to MacConkey Broth and then subcultured onto MacConkey Agar. - Which media are used for Salmonella testing?
The procedure uses RVS broth followed by subculture on XLDA. - Which selective media are used for Pseudomonas aeruginosa and Staphylococcus aureus?
Cetrimide Agar is used for Pseudomonas aeruginosa, while Mannitol Salt Agar is used for Staphylococcus aureus. - What should be done if growth is observed on selective media?
Any growth observed on selective media should be confirmed by a biochemical test. - What controls are included during testing?
The SOP includes negative controls and refers to GPT test data for positive controls. - What are the purified water microbiological limits shown in Annexure-I?
The annexure lists Alert: 20 CFU/ml, Action: 40 CFU/ml, and Limit: 100 CFU/ml.