







1. Introduction for Performance Qualification Protocol for Nitrogen Gas Generation & Distribution System:
The Performance Qualification Protocol for Nitrogen Gas Generation & Distribution System provides documented evidence that the system performs consistently and reproducibly within its established operating range and meets predefined acceptance criteria. The PSA-based system has a capacity of 10 Nm³/hr, nitrogen purity of 99.5%, outlet pressure of 5.5 kg/cm², and a dew point of –40°C. The qualification includes verification of documents, calibrated instruments, trained personnel, and performance testing for oil, moisture, CO₂, CO, nitrogen assay, oxygen, hydrocarbons, SO₂, dew point, nitrogen oxides, sterility, non-viable particles, and supply reliability.
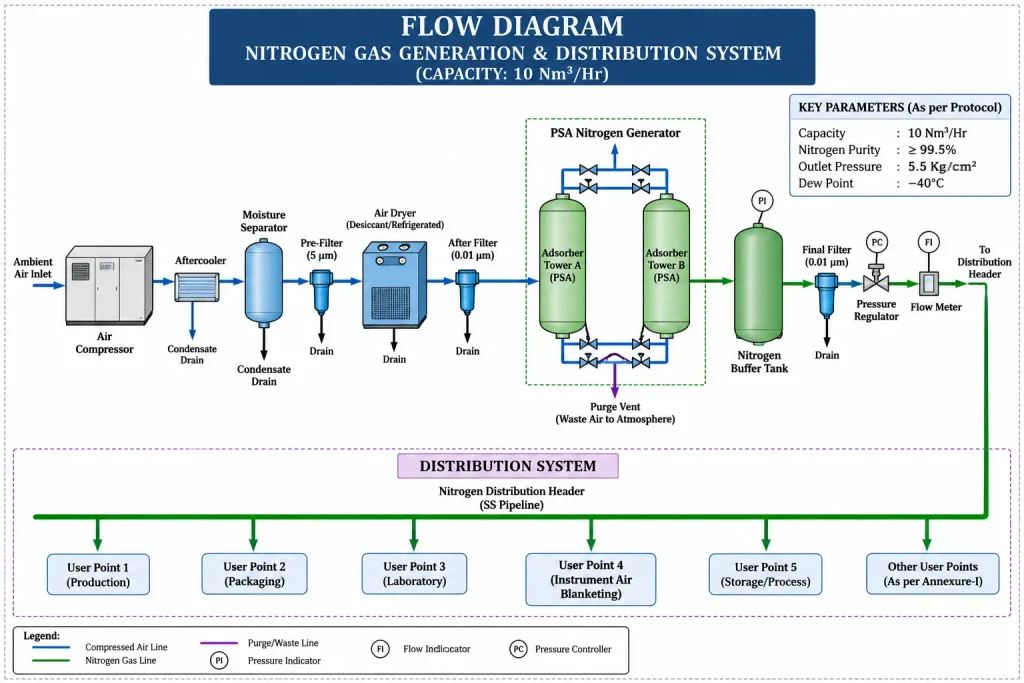
Skip to PDF content2. Flow Diagram – Nitrogen Gas Generation & Distribution System:
The flow diagram illustrates the complete sequence of nitrogen gas generation, purification, storage, and distribution. Atmospheric air is compressed, cooled, moisture-separated, filtered, and dried before entering the PSA nitrogen generator. In the PSA towers, oxygen, moisture, carbon dioxide, and other impurities are adsorbed, producing nitrogen of the required purity. The generated nitrogen is collected in a buffer/receiver tank, passed through final filtration, pressure regulation, and flow measurement, and then supplied through the distribution header to various user points. The diagram also indicates drains, purge arrangements, pressure monitoring, and other essential controls required for reliable nitrogen supply.
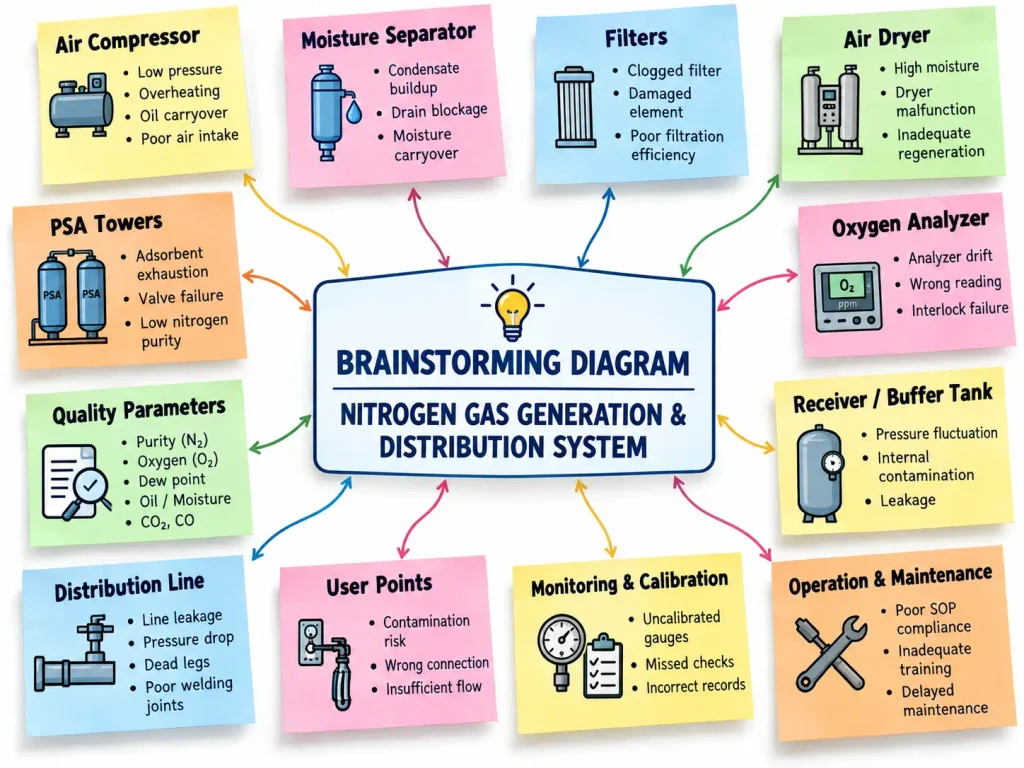
3. Brainstorming – Nitrogen Gas Generation & Distribution System:
The brainstorming diagram identifies major potential risks associated with the Nitrogen Gas Generation & Distribution System. Key areas include the air compressor, moisture separator, filters, air dryer, PSA towers, oxygen analyzer, receiver tank, distribution piping, user points, monitoring instruments, and maintenance practices. Possible failures such as low pressure, oil or moisture carryover, clogged filters, dryer malfunction, adsorbent exhaustion, low nitrogen purity, leakage, pressure drop, analyzer drift, and inadequate calibration are considered. The exercise helps the qualification team systematically identify possible causes of performance failure and supports development of appropriate monitoring, maintenance, testing, and preventive control measures.
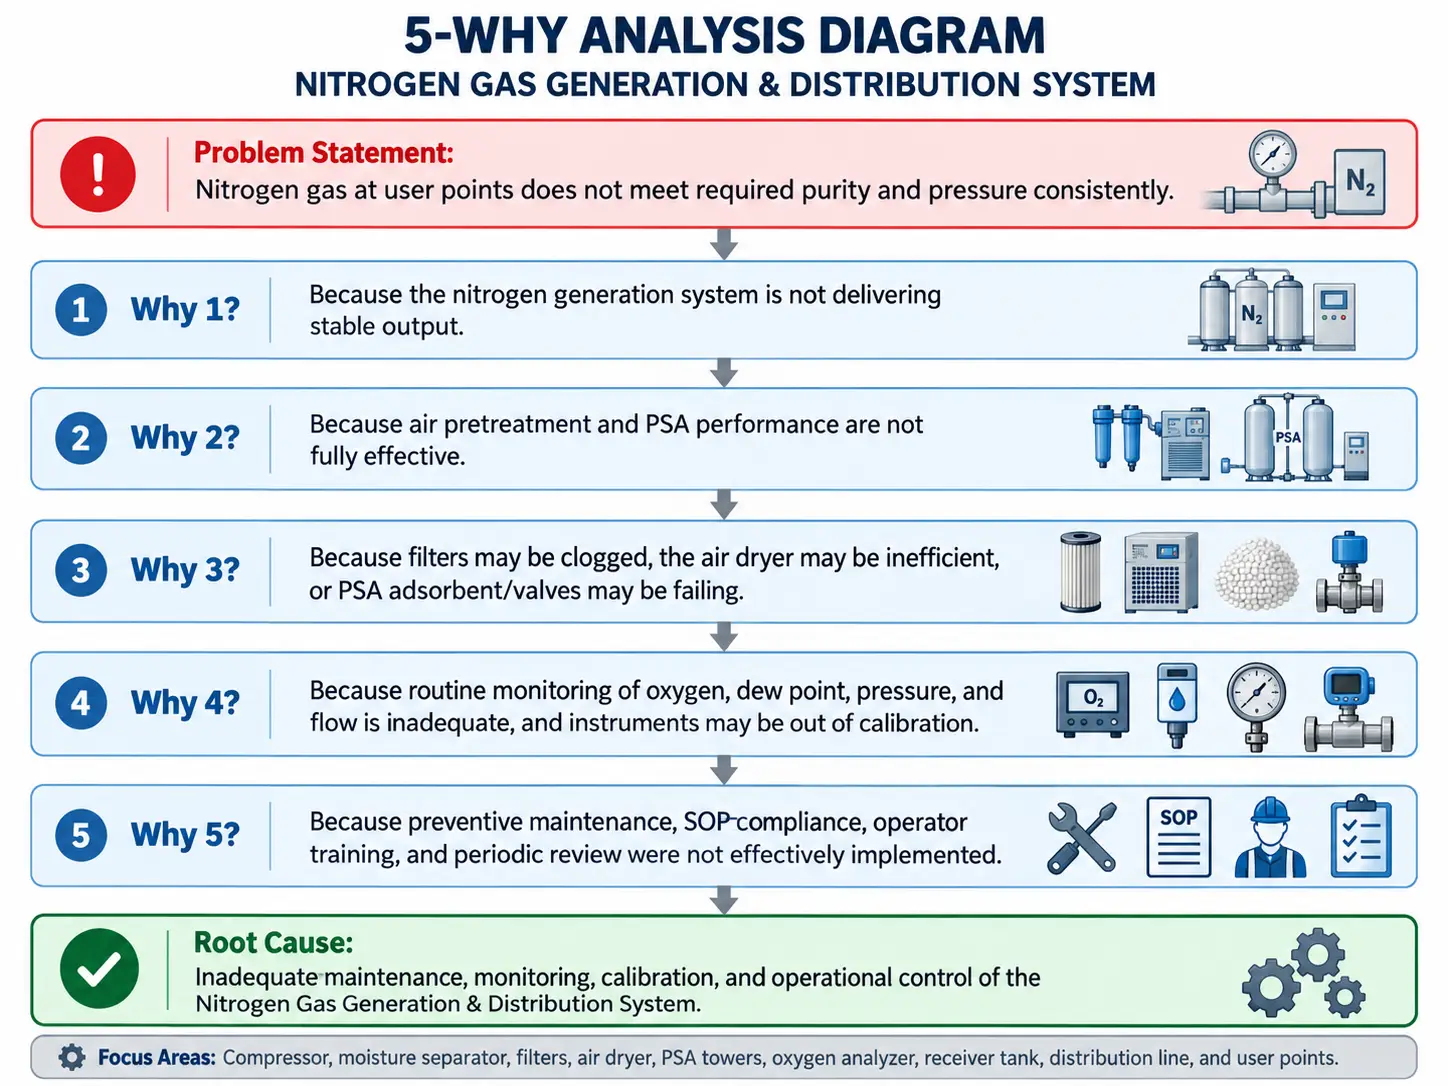
4. 5-Why Analysis – Nitrogen Gas Generation & Distribution System:
The 5-Why Analysis evaluates the possible root cause of inconsistent nitrogen gas purity and pressure at user points. The analysis traces the problem from unstable system output to ineffective air pretreatment and PSA performance. Further investigation identifies potential causes such as clogged filters, inefficient air drying, PSA adsorbent deterioration, valve malfunction, and inadequate monitoring of oxygen, dew point, pressure, and flow. It also considers out-of-calibration instruments and insufficient preventive maintenance. The final root cause highlights weaknesses in maintenance, monitoring, calibration, SOP compliance, operator training, and periodic system review, supporting appropriate corrective and preventive actions.
5. Heat Map – Nitrogen Gas Generation & Distribution System:
The Heat Map Analysis evaluates potential risks associated with the Nitrogen Gas Generation & Distribution System using Severity, Occurrence, and Detection ratings. Each identified hazard is assigned an RPN value to classify the risk as low, medium, high, or very high. Major concerns include low nitrogen purity, high moisture, oil carryover, low pressure or flow, gas impurities, PSA adsorbent degradation, distribution leakage, inaccurate instruments, and filter choking. The heat map visually highlights higher-risk areas using warmer colors, helping the qualification team prioritize critical issues and establish appropriate monitoring, maintenance, calibration, and preventive actions.