






1. INTRODUCTION – SOP FOR PREPARATION OF TREND CHART:
The SOP for Preparation of Trend Chart establishes a systematic procedure for collecting, compiling, trending, and analyzing quality-related data within the pharmaceutical quality system. The procedure is intended to identify recurring patterns, abnormal trends, deviations, and areas requiring improvement through periodic review of quality metrics. It covers data generated from change controls, market complaints, deviations, OOS, OOT, and analytical incidences, with responsibility assigned to the Quality Assurance department for execution and effective implementation. Trend analysis involves organizing relevant data, verifying its completeness and accuracy, and using suitable statistical tools or graphical presentations to evaluate performance over time. Trend charts may be prepared according to category, number of occurrences, and month of receipt to facilitate meaningful interpretation. The SOP therefore supports continual improvement, early identification of adverse quality signals, management review, and effective decision-making within the Pharmaceutical Quality System.
Skip to PDF content2. Flow Diagram – SOP for Preparation of Trend Chart:
The Flow Diagram for SOP for Preparation of Trend Chart illustrates the systematic sequence used for collecting, compiling, analyzing, and presenting quality-related data for trend evaluation. The process begins with collection of data from change controls, market complaints, deviations, OOS, OOT, and analytical incidences, followed by verification of data completeness, accuracy, and consistency.
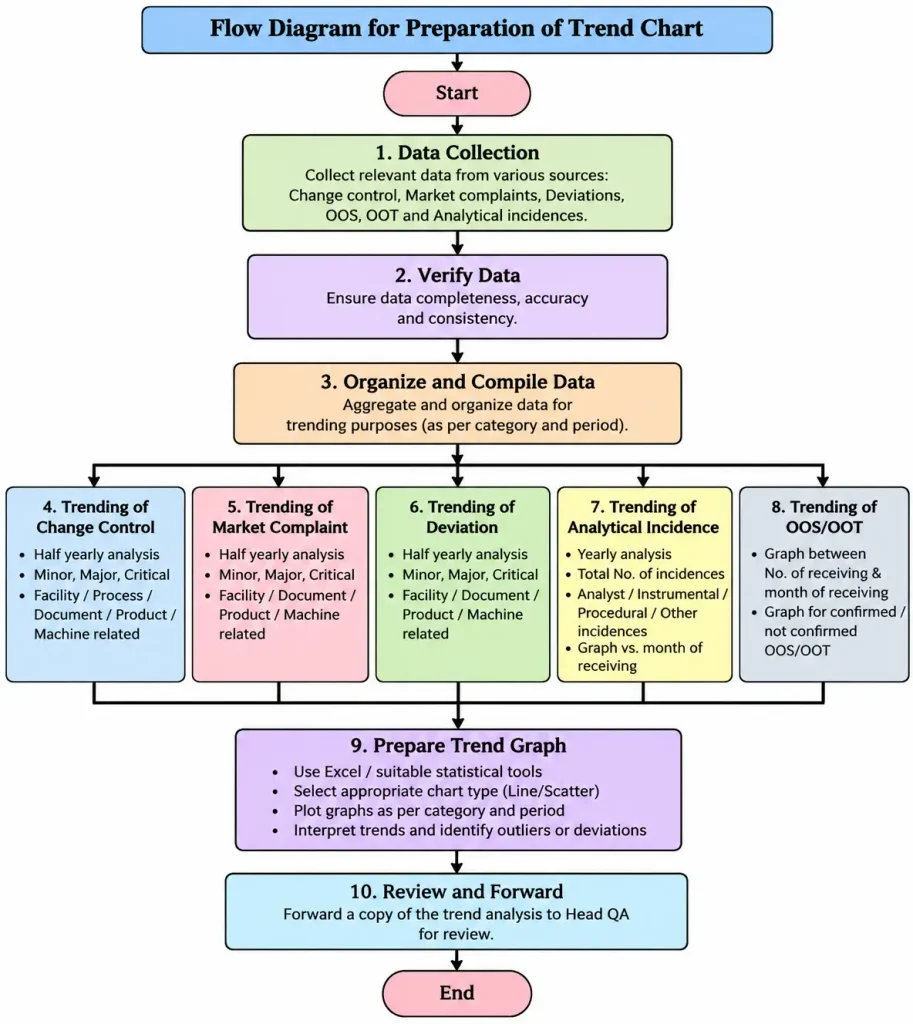
The collected data is organized according to defined categories and review periods. Trend analysis is then performed separately for change controls, complaints, deviations, analytical incidences, and OOS/OOT events. Suitable graphs are prepared using Excel or statistical tools to identify patterns, abnormal variations, and recurring issues. After completion, the trend analysis is reviewed and a copy is forwarded to Head QA for assessment and further action.
3. Benefits of SOP for Preparation of Trend Chart:
The SOP for Preparation of Trend Chart provides a structured approach for reviewing quality-related data and identifying meaningful patterns over time. By consistently trending change controls, market complaints, deviations, OOS, OOT, and analytical incidences, the organization can recognize recurring issues, unusual variations, and areas requiring improvement.
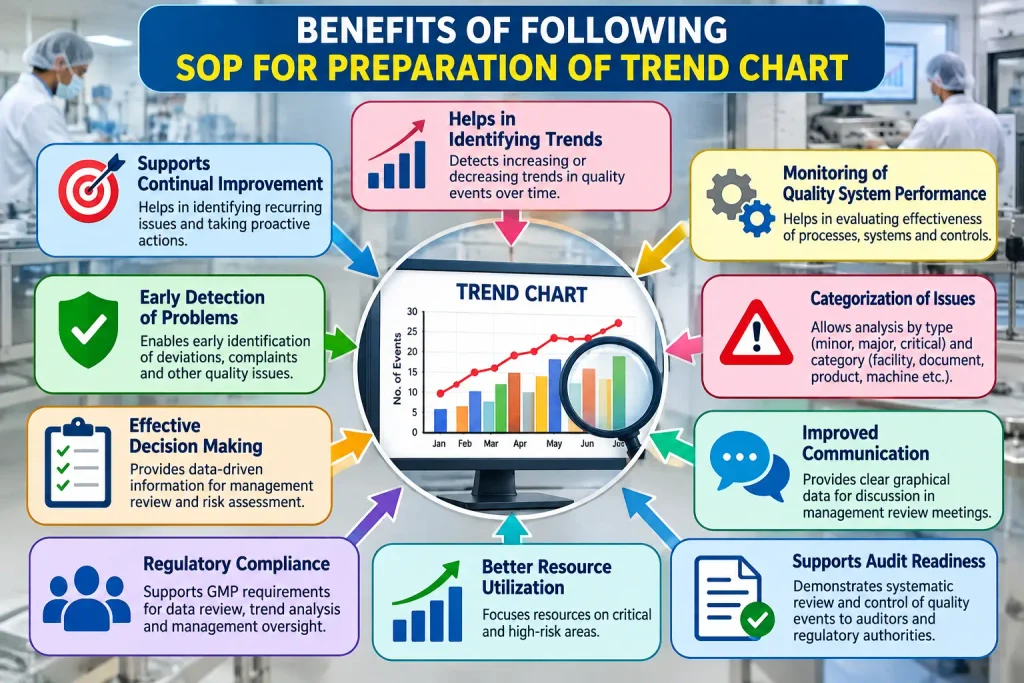
Following this SOP supports better quality system monitoring, data-based decision making, continual improvement, and management oversight. Categorization of events as minor, major, or critical and further classification by facility, document, product, process, or machine-related causes helps focus attention on important quality risks. Graphical presentation of data also makes trends easier to interpret, communicate, and review. The completed trend analysis is forwarded to Head QA, supporting systematic evaluation and appropriate follow-up within the Quality Assurance system.
4. Brainstorming Analysis – SOP for Preparation of Trend Chart:
The Brainstorming Analysis for SOP Failure – Preparation of Trend Chart identifies potential reasons that may lead to ineffective or incorrect trend analysis. Key failure areas include incomplete data collection, inaccurate data entry, inadequate data verification, insufficient training, delayed data compilation, unclear responsibility, software or Excel-related errors, improper categorization, incorrect graph preparation, lack of review, non-compliance with defined trending frequency, poor data integration, misinterpretation of trends, and documentation gaps.
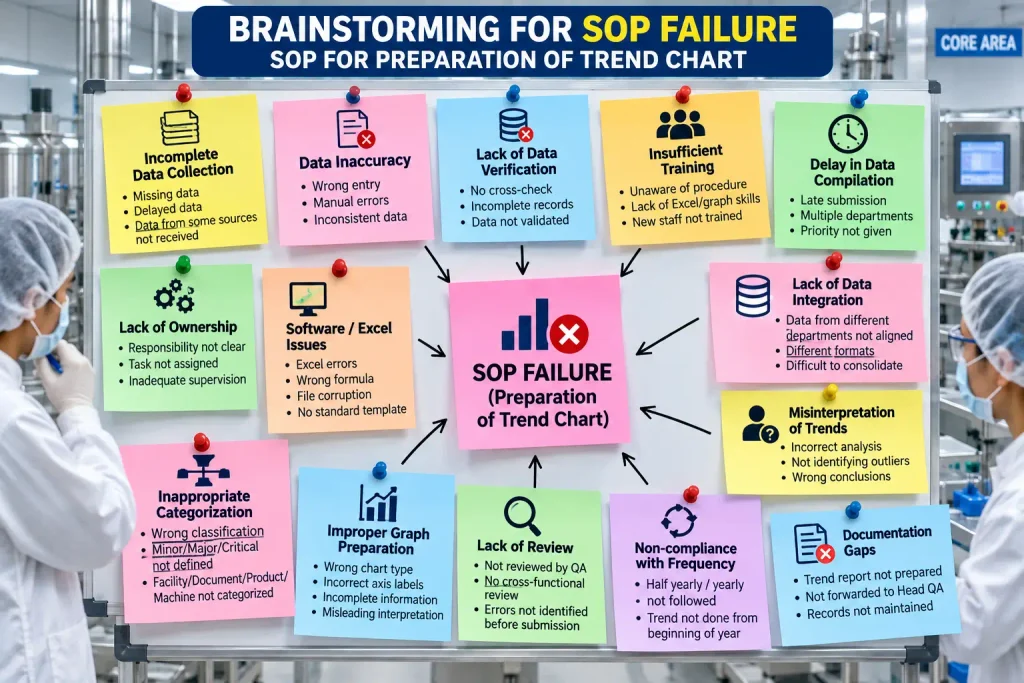
The SOP requires collection of relevant information from deviations, market complaints, change controls, OOS, OOT, and analytical incidences, together with verification of data completeness, accuracy, and consistency. Brainstorming these potential failure points helps QA identify weaknesses before they affect the reliability of the trend chart. It supports better data control, correct graphical presentation, timely review, and effective implementation of the trend-analysis process.
5. 5-Why Analysis – SOP for Preparation of Trend Chart:
The 5-Why Analysis for SOP Failure – Preparation of Trend Chart systematically identifies the underlying reasons why trend charts may be prepared incorrectly, incompletely, or not prepared as required. The analysis begins with incomplete or inaccurate data, followed by inadequate collection and verification of information from sources such as deviations, market complaints, change controls, OOS, OOT, and analytical incidences. The SOP specifically requires data to be complete, accurate, consistent, and properly organized before trending.
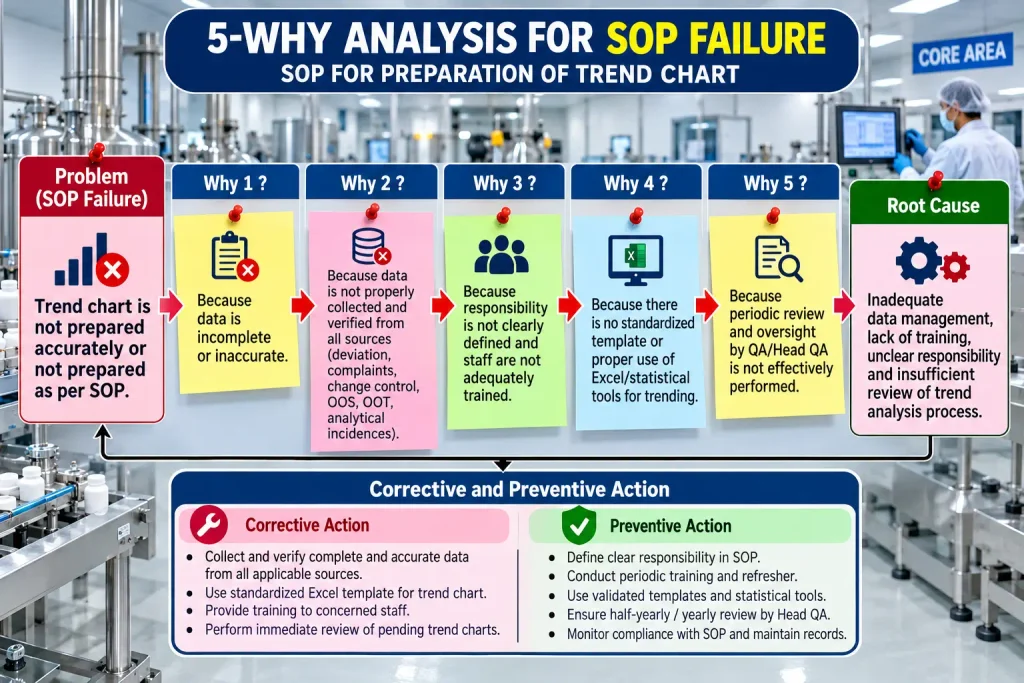
Further causes may include unclear responsibilities, insufficient training, improper use of Excel or statistical tools, and inadequate QA review. The SOP assigns execution and implementation responsibilities to QA personnel and requires defined periodic trending and review. The analysis helps identify the root cause and supports appropriate corrective and preventive actions to improve data reliability, trend-chart accuracy, compliance, and QA oversight.
6. Fishbone Analysis – SOP for Preparation of Trend Chart:
The Fishbone Analysis for SOP Failure – Preparation of Trend Chart identifies the major factors that can lead to inaccurate, incomplete, delayed, or missing trend charts. The analysis groups potential causes under Man, Machine, Method, Material, Mother Nature, Measurement, and Management. Typical causes include inadequate training, unclear responsibilities, Excel or software errors, improper data collection, incomplete records, incorrect categorization, lack of periodic review, and insufficient QA oversight.
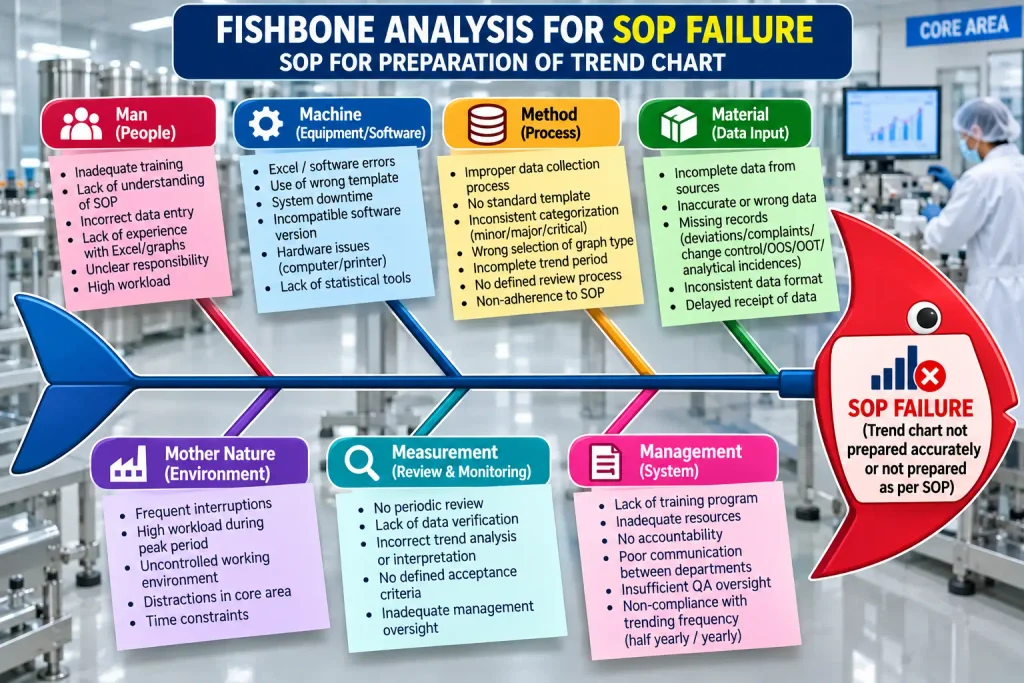
The SOP requires relevant data from deviations, market complaints, change controls, OOS, OOT, and analytical incidences to be collected and checked for completeness, accuracy, and consistency before trending. It also assigns responsibility for execution and effective implementation to QA personnel. This Fishbone Analysis helps systematically identify possible causes of SOP failure so that suitable corrective and preventive actions can be established to improve data reliability, trend-chart preparation, review, and overall quality-system effectiveness.
7. Fault Tree Analysis – SOP for Preparation of Trend Chart:
The Fault Tree Analysis for SOP Failure – Preparation of Trend Chart presents a structured method for identifying possible causes that may result in an incorrect, incomplete, delayed, or missing trend chart. The top event is linked to four major failure groups: incomplete or inaccurate data, process/method failure, human failure, and system/management failure.
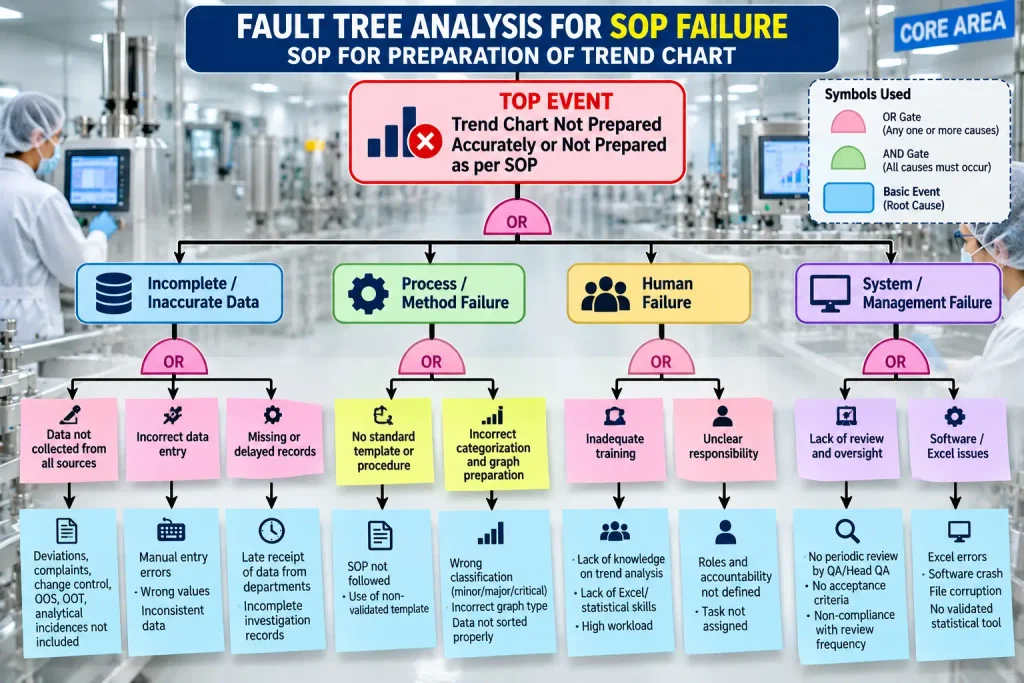
Potential contributing causes include missing source data, incorrect data entry, delayed records, improper categorization, incorrect graph preparation, inadequate training, unclear responsibilities, insufficient review, and Excel/software-related problems. The SOP specifically requires collection of data from deviations, market complaints, change controls, OOS, OOT, and analytical incidences, together with verification of data completeness, accuracy, and consistency. The analysis helps QA identify how individual failures can combine to affect reliable trend preparation and supports focused investigation, corrective action, preventive action, and stronger QA oversight.
8. Impact Assessment – SOP for Preparation of Trend Chart:
The Impact Assessment for SOP Failure – Preparation of Trend Chart evaluates the potential consequences of not preparing or reviewing trend charts as required. Failure to collect, compile, and analyze complete and accurate quality data may prevent timely identification of recurring deviations, complaints, OOS/OOT events, analytical incidences, and change-control patterns. The SOP specifically requires data completeness, accuracy, consistency, and systematic trending of relevant quality metrics.
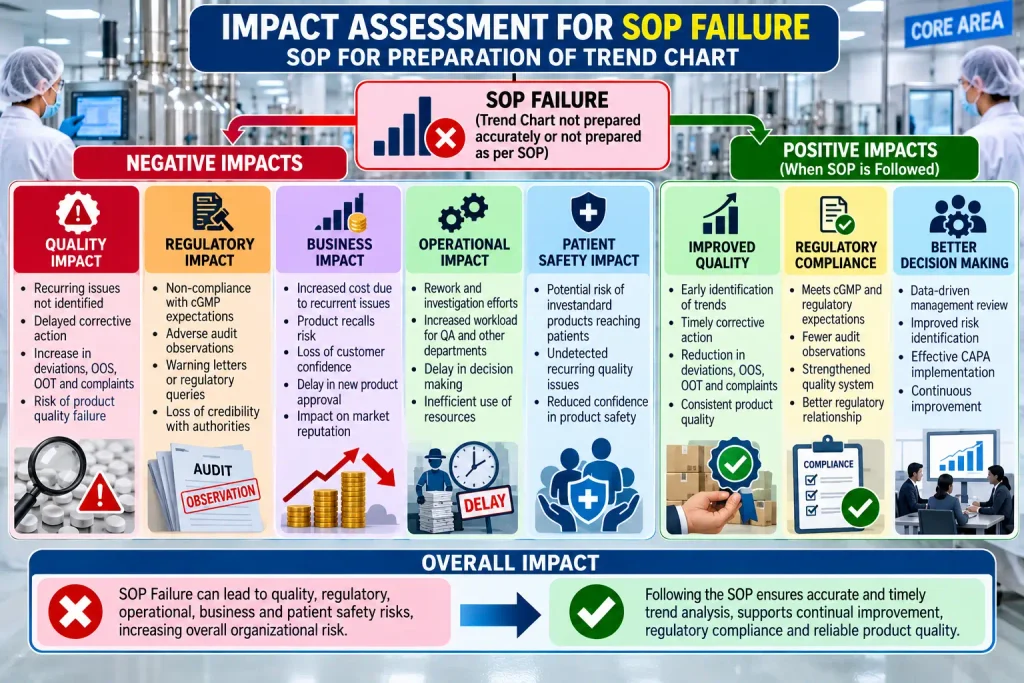
Improper implementation may therefore weaken quality monitoring, delay identification of adverse trends, and reduce the effectiveness of management review. Conversely, proper implementation supports structured evaluation of quality events, preparation of meaningful trend graphs, and identification of patterns or deviations from expected performance. The completed trend analysis is also required to be forwarded to Head QA, strengthening review and oversight.
9. CAPA – SOP for Preparation of Trend Chart:
The Corrective and Preventive Action (CAPA) for SOP Failure – Preparation of Trend Chart focuses on correcting deficiencies that may result in incomplete, inaccurate, delayed, or improperly reviewed trend charts. Corrective actions should address immediate gaps such as pending data collection, inaccurate entries, incorrect categorization, improper graph preparation, and incomplete review. The SOP requires relevant data to be collected from deviations, market complaints, change controls, OOS, OOT, and analytical incidences, and verified for completeness, accuracy, and consistency before trending.
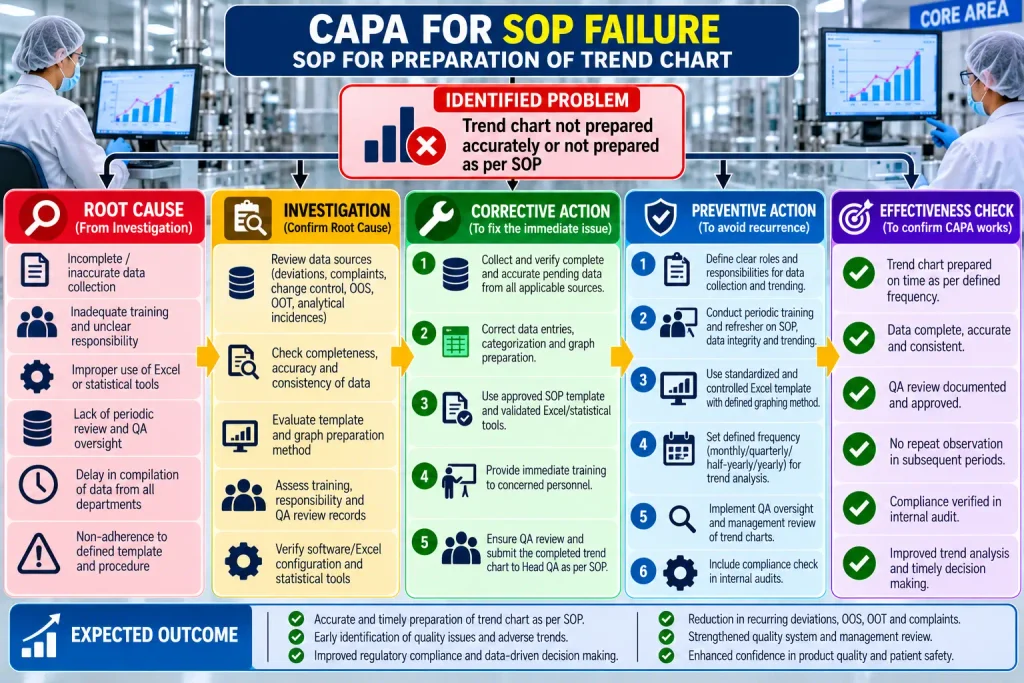
Preventive actions should strengthen the system through clearly defined responsibilities, periodic training, standardized data-compilation methods, controlled Excel or statistical tools, defined trending frequencies, and documented QA review. The SOP assigns QA responsibility for execution and implementation and requires periodic trending followed by forwarding the completed analysis to Head QA. An effectiveness check should confirm that trend charts are prepared on time, data is accurate and complete, reviews are documented, and recurring deficiencies do not reappear.
Questions & Answers – SOP for Preparation of Trend Chart:
- Q: What is the purpose of the SOP for Preparation of Trend Chart?
A: The purpose is to define a procedure for trending and analyzing quality-related data such as quality metrics, deviations, complaints, and change controls to support improvement within the organization. - Q: Which department is responsible for execution of this SOP?
A: The Officer/Executive – QA is responsible for execution of the SOP, while the Assistant Manager QA and Head QA/QC are responsible for effective implementation. - Q: What types of data are collected for trend analysis?
A: Data are collected from deviations, market complaints, change controls, OOS, OOT, and analytical incidences. - Q: What should be ensured before starting trend analysis?
A: The collected data should be checked for completeness, accuracy, and consistency to ensure reliability. - Q: What is trend analysis according to the SOP?
A: Trend analysis is the collection or compilation of data for a parameter or activity and arranging it in a specified manner to analyze the responses obtained. - Q: How frequently is change-control trending performed?
A: QA carries out trend analysis of change controls on a half-yearly basis, beginning from the start of the year. - Q: How are change controls categorized for trending?
A: Change controls are trended as minor, major, and critical, and may also be classified as facility-related, process/procedure-document-related, product-related, machine-related, etc. - Q: How frequently are market complaints reviewed for trend analysis?
A: Market complaints are continuously trended and formally analyzed on a half-yearly basis by QA. - Q: How frequently is deviation trend analysis performed?
A: Deviation trend analysis is carried out on a half-yearly basis. Deviations are categorized as minor, major, and critical. - Q: How frequently is analytical-incidence trending performed?
A: Analytical incidence trend analysis is performed on a yearly basis from the beginning of the year. - Q: Which categories are considered for analytical-incidence trending?
A: Analytical incidences may be categorized as Analyst, Instrumental, Procedural, and other incidences. - Q: How are OOS and OOT results trended?
A: Graphs are prepared between the number received and month of receipt, and another graph is prepared between the number of OOS/OOT received and whether they were confirmed or not confirmed. - Q: Which software is mentioned for preparation of trend graphs?
A: The SOP specifies use of an Excel sheet for entering data and preparing the trend graph. - Q: Which chart types may be used for trend graphs?
A: The SOP mentions selecting a Line or Scatter chart, depending on the nature of the data. - Q: What do the X-axis and Y-axis represent?
A: The SOP states that the X-axis represents the independent variable, while the Y-axis represents the dependent variable. - Q: What should be done after completion of the graph?
A: After the graph is prepared, the data should be saved and the completed trend analysis should be forwarded to Head QA. - Q: What trend-chart annexures are listed in the SOP?
A: The SOP lists trend charts for change control, deviation, market complaint, OOS, OOT, and analytical incidences as annexures. - Q: Where is the controlled copy of this SOP distributed?
A: The controlled copy is distributed to the Quality Assurance Department.
Reference Guidelines – SOP for Preparation of Trend Chart:
- Trend Analysis of Change Control
- Trend Analysis of Deviation
- Trend Analysis of Market Complaint
- Trend Analysis of Analytical Incidence
- ICH Q10 – Pharmaceutical Quality System
- ICH Q9 – Quality Risk Management
- ICH Q8 – Pharmaceutical Development
- WHO GMP – Good Manufacturing Practices for Pharmaceutical Products
- EU GMP – Chapter 1: Pharmaceutical Quality System
- PIC/S Guide to GMP – Pharmaceutical Quality System
- US FDA 21 CFR Parts 210 and 211 – Current Good Manufacturing Practice
- US FDA Guidance for Industry – Quality Systems Approach to Pharmaceutical CGMP Regulations
- Schedule M, Drugs and Cosmetics Rules, India – Good Manufacturing Practices
- ICH Q2 – Validation of Analytical Procedures, where analytical/OOS/OOT trending is applicable.