






Brief Description
This SOP explains the procedure for preparing and reviewing microbiological trends for environment monitoring and water monitoring. The main purpose is to study microbiological results over time and identify any unusual increase, decrease, variation, or out-of-trend result. Monitoring results are entered in Excel and reviewed before preparing trend charts. Environmental monitoring trends are prepared quarterly, while water monitoring trends are prepared monthly. The trend graph should show sampling dates on the X-axis, test results on the Y-axis, and clearly display the alert and action limits.The microbiologist prepares the trend, which is checked by the section head and approved by Quality Assurance. Any atypical result, excursion, seasonal change, peak, or microorganism identification should be reviewed and documented with proper conclusions and investigation where required. A summary sheet is also prepared to record results, limits, conclusions, and action plans.
Skip to PDF content1. Flow Diagram:
The flow diagram explains the step-by-step process for preparing microbiological trends for environmental and water monitoring. The process starts with carrying out monitoring according to the approved schedule. All results are entered in Excel and reviewed before trend preparation. Environmental monitoring trends are prepared quarterly, while water monitoring trends are prepared monthly. The trend chart includes monitoring dates, result values, sampling locations, and alert and action limits.
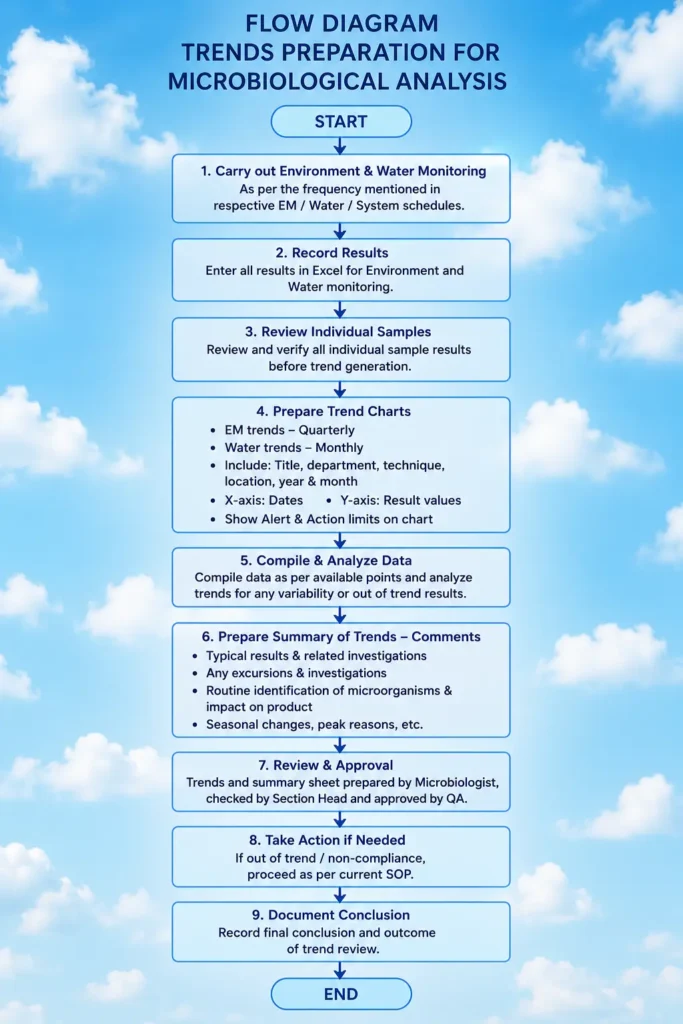
After preparing the chart, the collected data is analyzed to identify unusual variations, peaks, excursions, or out-of-trend results. A summary is prepared describing typical results, investigations, microorganism identification, seasonal changes, and possible product impact. The trend and summary are prepared by the Microbiologist, checked by the Section Head, and approved by Quality Assurance. If any non-compliance is found, appropriate investigation and action are taken according to the applicable SOP.
2. Brainstorming for SOP Failure:
Brainstorming is a simple investigation technique used to identify the possible reasons behind an SOP failure. In this method, team members from relevant departments discuss the problem openly and list all possible causes without immediately rejecting any idea. Common causes may include lack of training, unclear instructions, poor documentation, skipped steps, inadequate review, communication gaps, high workload, insufficient monitoring, missing approvals, and equipment or material issues.
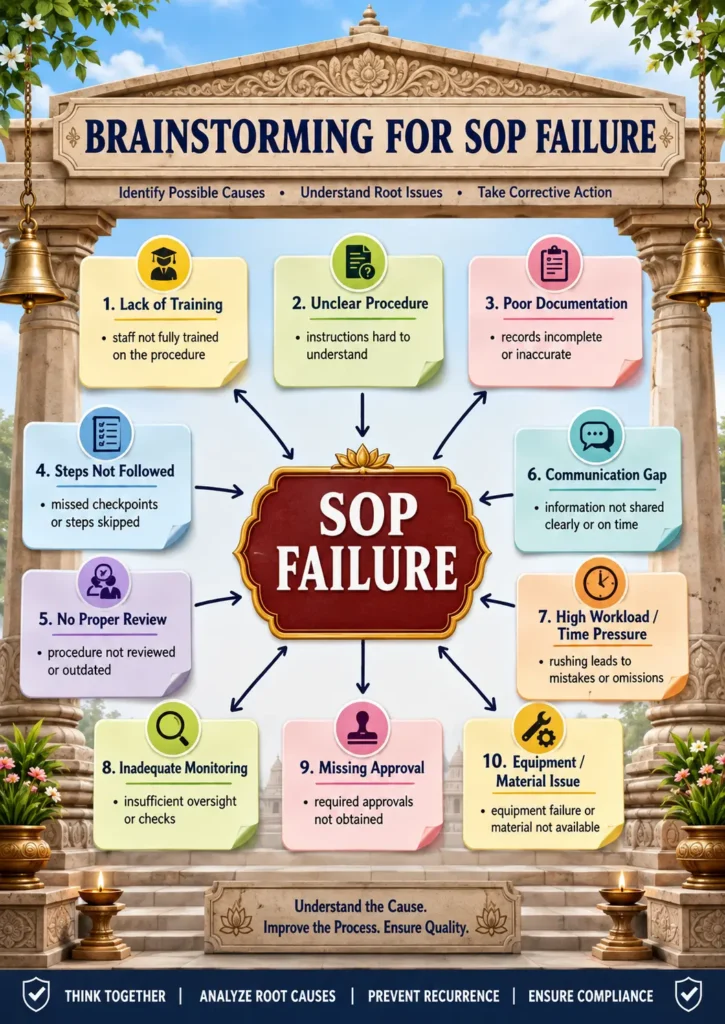
The main purpose of brainstorming is to collect different viewpoints and understand where the process may have failed. After listing the possible causes, the team reviews and groups them according to their importance and likelihood. The most relevant causes are then selected for further root cause analysis using tools such as 5-Why Analysis, Fishbone Diagram, or FMEA. Proper brainstorming supports effective corrective and preventive actions and helps reduce the chance of the same SOP failure happening again.
3. 5-Why Analysis for SOP Failure:
The 5-Why Analysis is a simple root cause investigation tool used to understand why an SOP failed or was not followed correctly. The analysis starts with the main problem, such as an operator not following the required SOP, and then asks “Why?” five times to reach the actual root cause.Possible reasons may include lack of awareness, inadequate training, poor understanding of the procedure, absence of competency checks, unclear responsibilities, and weak QA monitoring. For microbiological trend preparation, the SOP assigns responsibility to the Microbiologist and requires proper implementation and review by responsible quality personnel.
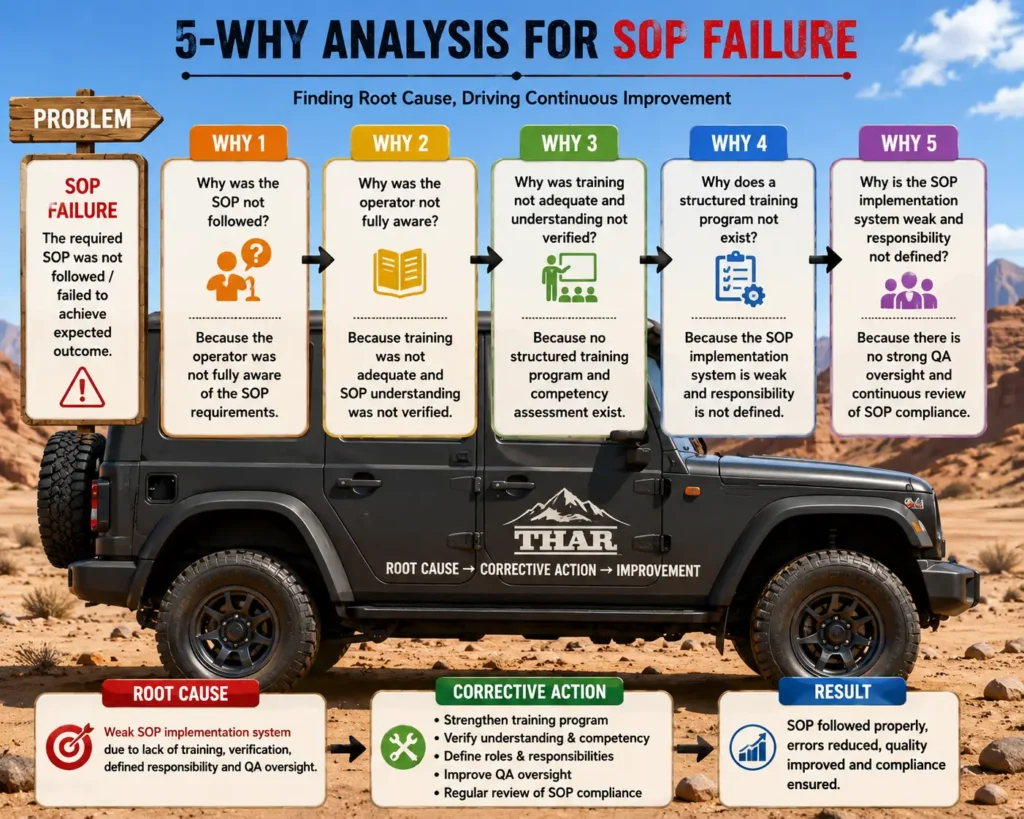
After identifying the root cause, suitable corrective actions are taken, such as improving training, checking employee understanding, defining responsibilities, strengthening QA oversight, and periodically reviewing SOP compliance. This method helps prevent repeated failures, improves employee understanding, strengthens compliance, and supports better quality system performance.
4. Fishbone Analysis for SOP Failure:
The Fishbone Analysis, also called the Ishikawa Diagram, is used to identify and organize the possible causes of an SOP failure. The problem, “SOP Failure,” is placed at the head of the fishbone, while different cause categories are shown as major branches.Common causes include inadequate training, unclear or outdated procedures, poor documentation, personnel errors, equipment or material problems, weak review and monitoring, communication gaps, and workload or environmental issues. Each main category can be further divided into specific causes such as missing competency checks, incorrect records, lack of supervision, delayed information, staff shortage, or instrument problems.
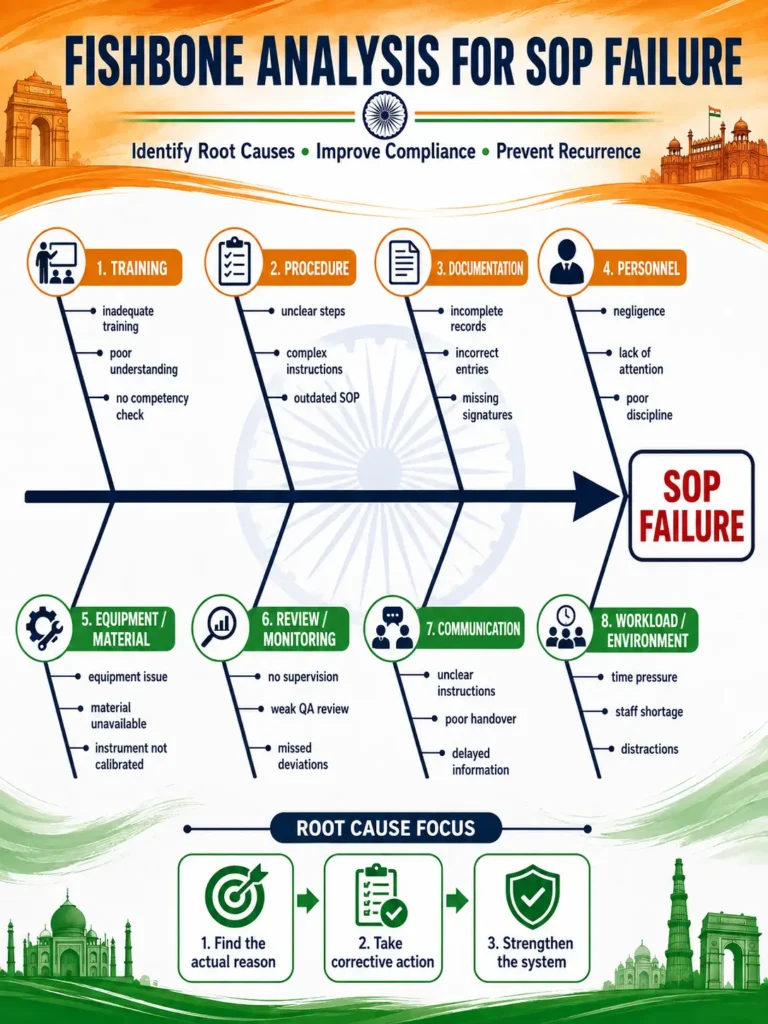
The diagram helps the investigation team look at the problem from different angles instead of focusing on only one reason. After reviewing all possible causes, the team can identify the most likely root cause, take suitable corrective action, strengthen the SOP system, and reduce the chance of recurrence.
5. Fault Tree Analysis for SOP Failure:
Fault Tree Analysis (FTA) is a structured investigation tool used to identify the possible root causes of an SOP failure. The analysis starts with the top event, such as “SOP not followed or ineffective,” and then breaks the problem into different contributing causes.Major causes may include people, procedure, material, equipment, environment, and management. These causes are further divided into specific basic events such as lack of training, unclear procedures, missing competency checks, poor maintenance, inadequate monitoring, weak supervision, and poor communication.
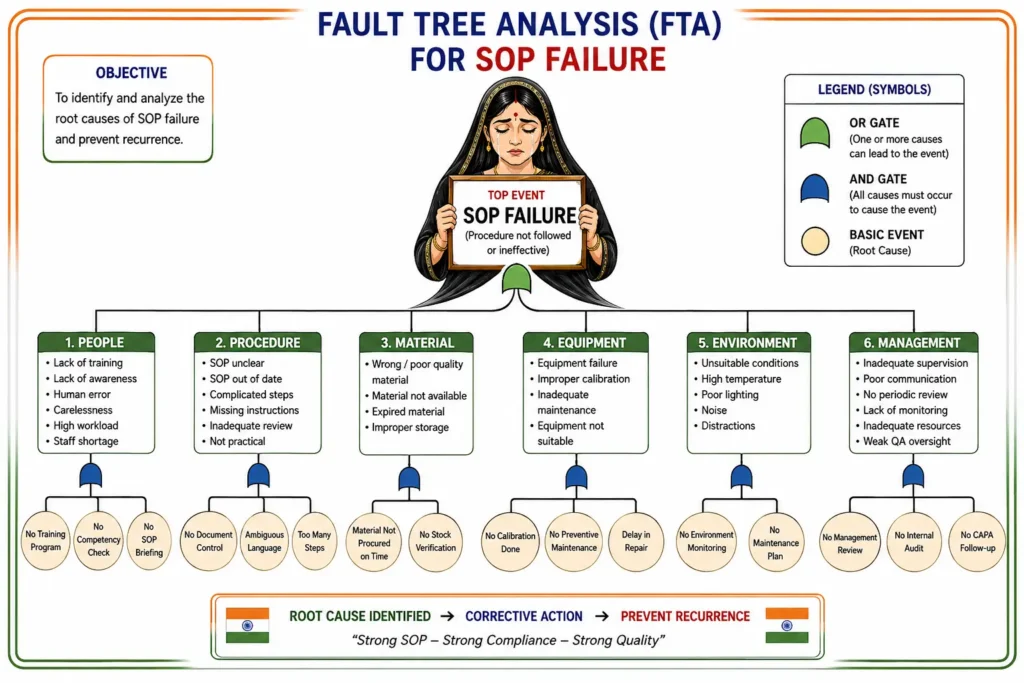
The diagram uses logical gates such as OR Gate and AND Gate to show how one or more causes may combine and result in SOP failure. FTA helps the investigation team understand the relationship between different causes, identify the most critical root cause, and take suitable corrective actions. It supports better SOP compliance, stronger quality systems, and prevention of repeated failures.
Questions & Answers – Trends Preparation for Microbiological Analysis
Q1. What is the objective of this SOP?
Answer: The objective is to provide a procedure for preparing microbiological trends.
Q2. What is the scope of this SOP?
Answer: It is applicable to trend preparation for environmental monitoring and water monitoring.
Q3. Who is responsible for executing this SOP?
Answer: The Microbiologist is responsible for execution of the SOP.
Q4. Where should monitoring results be recorded?
Answer: Environment and water monitoring results should be entered in Excel and reviewed before trend generation.
Q5. How frequently are environmental monitoring trends prepared?
Answer: Environmental monitoring trends are prepared on a quarterly basis.
Q6. How frequently are water monitoring trends prepared?
Answer: Water monitoring trends are prepared on a monthly basis.
Q7. What should be shown on the X-axis and Y-axis of the trend chart?
Answer: The X-axis should show monitoring dates, while the Y-axis should show the result values.
Q8. Should alert and action limits be shown on the trend chart?
Answer: Yes. Both alert and action limits should appear on the trend chart.
Q9. Who prepares, checks, and approves the trends?
Answer: The trends are prepared by the Microbiologist, checked by the Section Head, and approved by Quality Assurance.
Q10. What should be included in the trend summary comments?
Answer: The summary should include atypical results, excursions, related investigations, microorganism identification, seasonal changes, and reasons for any observed peaks.
Q11. What should be done if an environmental monitoring result is out of trend?
Answer: The reason should be investigated and a conclusion should be documented. In case of non-compliance, the current Out-of-Trend SOP should be followed.
Q12. What information is included in the Summary of Trends annexure?
Answer: It includes department, technique, frequency, trend duration, reference method number, sampling point, microbiological results, limits, conclusion, and action plan.