





1. Brief Description:
The Post Risk Analysis for the Water System (Cepha Block) evaluates risks associated with the existing purified water system used for manufacturing and cleaning operations. The system is designed to provide purified water meeting specified quality requirements and to support product safety. The assessment covers the design, installation, operation, performance, utilities, operating personnel, instruments, control points, and potential failure modes of the water system. Risk evaluation is performed using the FMECA methodology in line with the organization’s Risk Management Manual and ICH Q9. The water treatment process includes bore well water chlorination, softening, ultrafiltration, pH correction, SMBS and antiscalant dosing, two-stage reverse osmosis, EDI, UV treatment, storage, and closed-loop distribution. Risks are ranked using Severity, Occurrence, and Detection scores to calculate RPN. Based on the defined acceptance criteria, higher-risk conditions require CAPA, while minor risks may not require additional action. This structured review supports verification of existing control measure adequacy.
Skip to PDF content2. Flow Diagram:
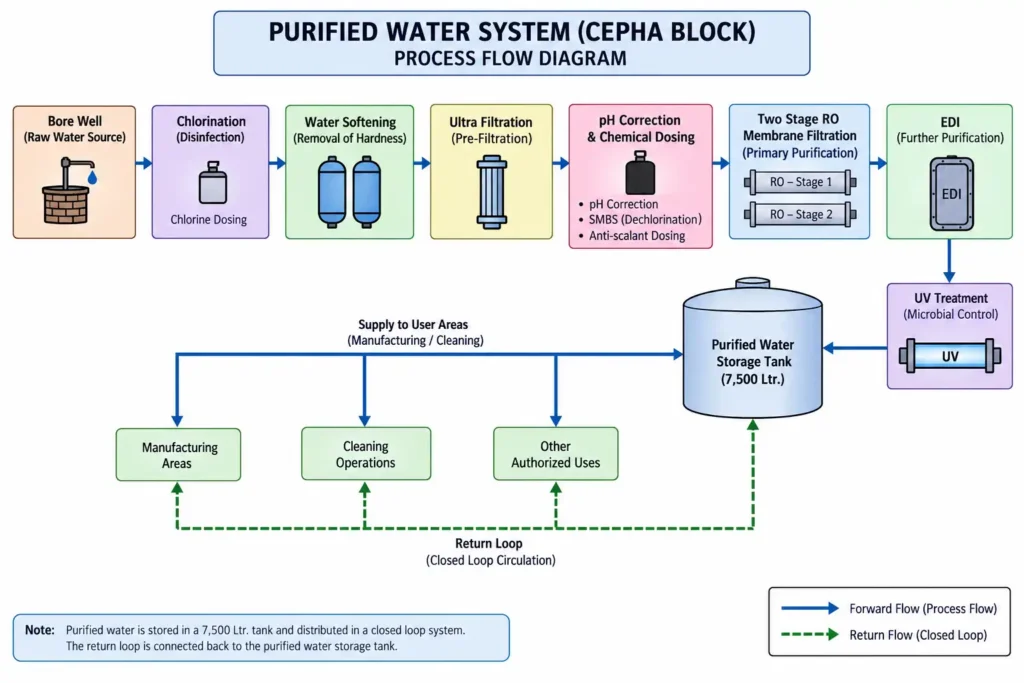
The Purified Water System (Cepha Block) Flow Diagram illustrates the sequential treatment and circulation of water used for pharmaceutical manufacturing and cleaning operations. The process begins with bore well water, which undergoes chlorination to control microbial contamination. The water is then passed through softening and ultrafiltration stages to reduce hardness and suspended impurities. After this, pH correction, SMBS dosing, and antiscalant dosing are performed to protect the downstream purification system and remove residual chlorine. The treated water subsequently passes through two-stage Reverse Osmosis (RO) followed by EDI for further purification and ionic contaminant removal. It is then subjected to UV treatment for microbial control before being collected in the 7,500-litre purified water storage tank. Purified water is distributed to manufacturing and cleaning areas through a closed circulation loop, with the return line connected back to the storage tank.
3. Brainstorming:
The brainstorming analysis for “Post Risk Analysis for the Water System (Cepha Block) not performed” identifies possible organizational, procedural, technical, and documentation-related reasons for the missed activity. Key potential causes include lack of awareness of the requirement, absence of the activity from the annual schedule, unclear responsibility, limited manpower, inadequate knowledge of FMECA, insufficient cross-functional support, incomplete documentation, lack of historical data, personnel changes, weak management follow-up, and failure to trigger risk reassessment after system changes. The exercise also considers complacency arising from the assumption that the water system is functioning satisfactorily.
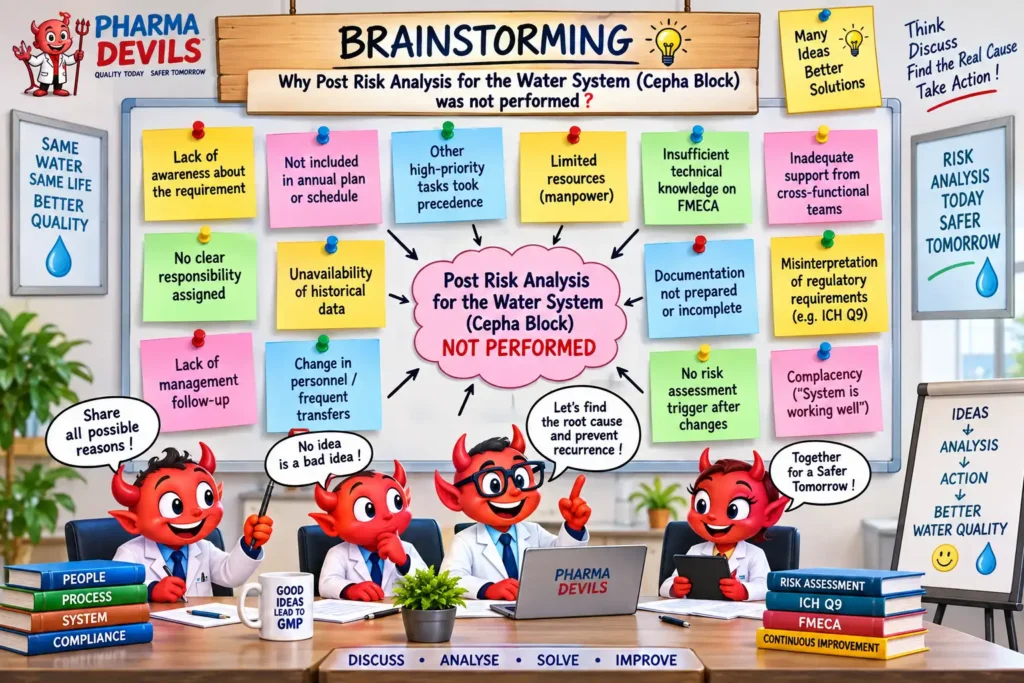
The purpose of brainstorming is to collect all plausible causes before selecting the most likely root causes for further investigation. The identified causes can then be evaluated using tools such as 5-Why analysis, Fishbone analysis, or CAPA planning to strengthen compliance, accountability, and timely completion of post-risk assessment activities.
4. 5 Why Analysis:
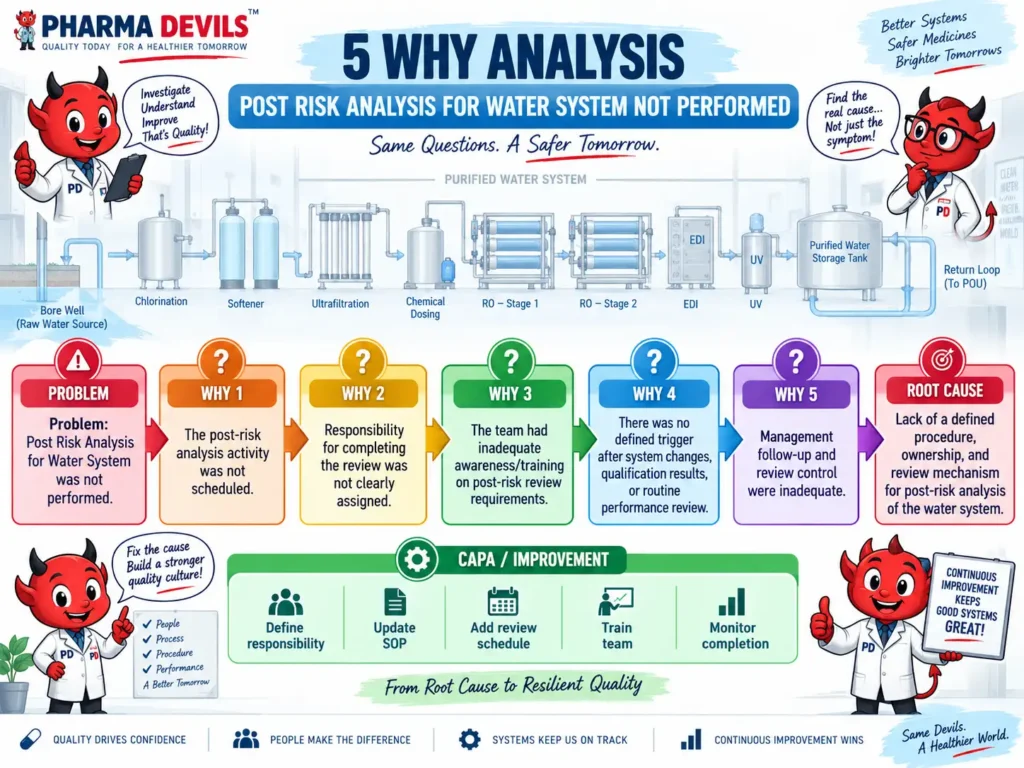
The 5 Why Analysis for “Post Risk Analysis for the Water System Not Performed” identifies the underlying reasons why the required post-risk review activity was missed. The analysis begins with the problem that the post-risk assessment was not completed and traces the cause through successive “Why” questions. The main reasons identified include failure to schedule the activity, unclear responsibility for completing the review, inadequate awareness or training regarding post-risk assessment requirements, absence of a defined trigger after system changes or performance review, and insufficient management follow-up. These contributing factors indicate that the issue was not only a personnel-related lapse but also a weakness in the overall quality system. The root cause is identified as the lack of a clearly defined procedure, ownership, review mechanism, and monitoring system for post-risk analysis. Appropriate CAPA should therefore include defined responsibility, SOP revision, scheduled reviews, training, and periodic monitoring of completion.
5. FAILURE MODE EFFECT ANALYSIS:
The Failure Mode and Effects Analysis (FMEA) for the Water System evaluates potential failures that may affect purified water quality, system performance, and GMP compliance. The assessment reviews critical stages such as bore well water treatment, chlorination, softening, filtration, ultrafiltration, RO-EDI treatment, chemical dosing, UV treatment, storage, and distribution. Each potential failure is evaluated using Severity (S), Occurrence (O), and Detection (D), and the Risk Priority Number (RPN) is calculated as S × O × D.
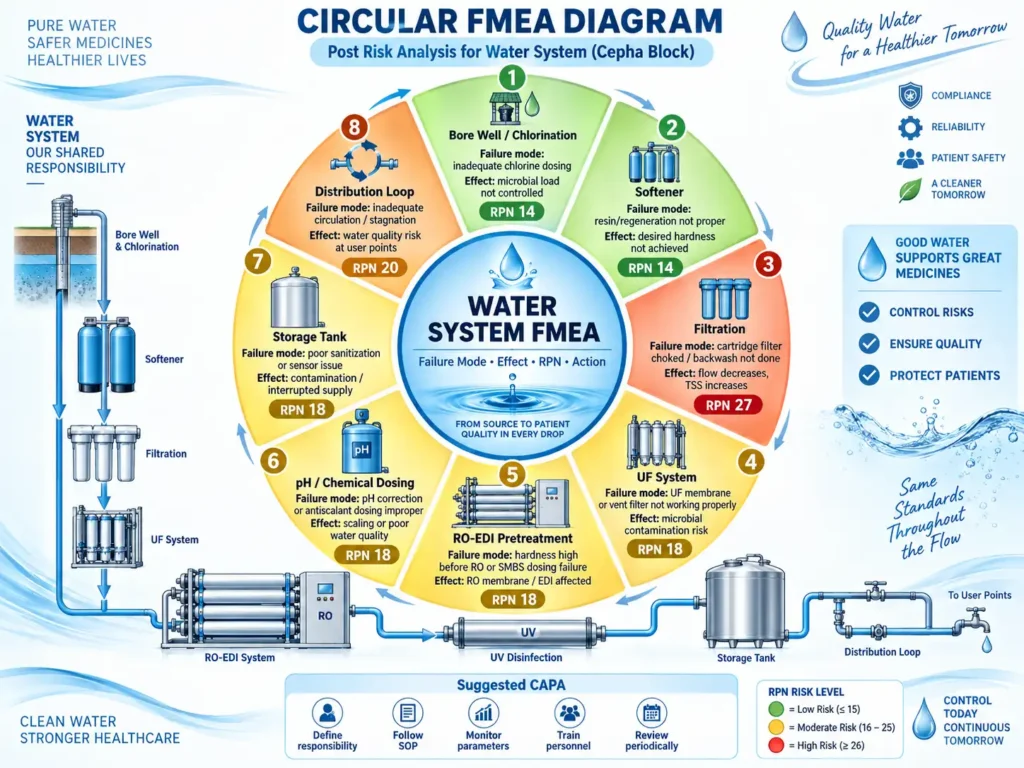
The analysis helps identify risks such as improper dosing, membrane or filter failure, inadequate sanitization, poor calibration, microbial contamination, and interrupted water supply. Existing controls, monitoring practices, SOPs, qualification, preventive maintenance, and recommended actions are reviewed to determine whether risks are adequately controlled. The FMEA supports prioritization of higher-risk failure modes and helps establish appropriate CAPA, responsibility, monitoring, and periodic review to maintain consistent purified water quality.
Critical Process Parameters (CPP) & Critical Quality Attributes (CQA) – Purified Water System
The attached Post Risk Analysis does not provide a separate CPP/CQA table. The following classification is derived from the process parameters, failure modes, controls, and specifications identified in its FMECA.
Critical Process Parameters (CPP)
| S.No. | Process Stage | Critical Process Parameter | Requirement / Control |
|---|---|---|---|
| 1 | Raw Water | Bore well water quality | Monitor as per approved sampling/testing procedure |
| 2 | Chlorination | Chlorine dosing | 2 ppm dosing with pump interlock |
| 3 | Softener | Regeneration & hardness control | Regeneration and hardness monitoring as per SOP |
| 4 | Filtration | Filter condition / differential pressure | Monitor pressure before and after filters; timely backwashing |
| 5 | Ultrafiltration | UF membrane condition | Pressure before/after membrane and scheduled sanitization |
| 6 | RO Feed | Feed-water hardness | NMT 5 ppm before RO stages |
| 7 | pH Correction | Feed-water pH | 6.5–8.5 as stated in the risk assessment |
| 8 | SMBS Dosing | SMBS dosage / dechlorination | Dosing as per SOP; ORP-based control and dumping/interlock |
| 9 | Antiscalant | Antiscalant dosing rate | Automatic dosing with appropriate flow; pressure monitoring |
| 10 | RO Stage I & II | RO operating performance / conductivity | Conductivity monitored after RO stages |
| 11 | RO Pass-II | Conductivity | NMT 20 µS according to the document |
| 12 | EDI | Conductivity & flushing | Conductivity meter calibrated; out-of-limit water prevented from proceeding |
| 13 | UV | UV lamp performance | Burning hours monitored; lamp replacement at defined frequency |
| 14 | Water System | Sanitization frequency | Sanitization according to established SOP/frequency |
| 15 | Storage Tank | Tank level / level sensor | Level sensor and pump interlocking maintained |
| 16 | Distribution Loop | Return velocity / circulation | NLT 1.2 m/s or 4100 L/hour |
| 17 | Distribution | Dead-leg control | Zero-dead-leg sampling points; closed-loop circulation |
| 18 | Sampling | Sampling frequency | Defined sampling points and schedule; return point sampled daily |
Critical Quality Attributes (CQA)
| S.No. | Critical Quality Attribute | Quality Impact |
|---|---|---|
| 1 | Purified water conformity to specification | Ensures water is suitable for pharmaceutical manufacturing and cleaning |
| 2 | Conductivity | Indicates ionic/chemical purity and effectiveness of RO/EDI treatment |
| 3 | pH | Supports proper RO/EDI operation and water quality |
| 4 | Microbial load/count | Critical for preventing microbial contamination of water and product |
| 5 | Hardness | Excess hardness can affect RO membrane and EDI performance |
| 6 | Suspended solids / TSS | Increased TSS indicates ineffective filtration and can affect downstream stages |
| 7 | Residual chlorine control | Excess chlorine can adversely affect RO membranes and EDI |
| 8 | Chemical quality | Ensures purified water complies with required chemical specifications |
| 9 | Water quality at user points | Demonstrates that quality is maintained throughout the distribution loop |
| 10 | Consistent water quality during circulation | Prevents deterioration or microbial growth during storage/distribution |
The report specifically links improper conductivity, hardness, chemical dosing, microbial control, sanitization, UV operation, and circulation to failure of purified-water quality.
Important: The document does not state specific final purified-water limits for parameters such as TOC or final microbial count in the retrieved sections, so those limits should be taken from the applicable approved water specification rather than invented here.
Questions & Answers – Post Risk Analysis for Water System
Q1. What is the purpose of the Post Risk Analysis for the Water System?
Answer: The purpose is to assess risks associated with the existing purified water system and determine whether the system can consistently provide water meeting the required pharmaceutical specifications.
Q2. Which risk assessment methodology is used in the document?
Answer: The assessment is performed using FMECA – Failure Mode, Effects and Criticality Analysis.
Q3. What are the main stages of the purified water system?
Answer: The system includes bore well water, chlorination, softening, ultrafiltration, pH correction, SMBS and antiscalant dosing, two-stage RO, EDI, UV treatment, storage, and closed-loop distribution.
Q4. Why is bore well water chlorinated?
Answer: Chlorination is performed to reduce the microbial load in the raw water before further treatment.
Q5. What chlorine dosing level is mentioned in the risk assessment?
Answer: The document states that chlorine dosing is performed at 2 ppm with interlocking between the bore well water supply and dosing pump.
Q6. What may happen if the chlorine dosing pump does not work properly?
Answer: Microbial growth may not be adequately controlled, which can ultimately affect the quality of the water system.
Q7. Why is hardness monitored before the RO system?
Answer: Increased hardness may adversely affect the RO membranes and EDI. The document identifies NMT 5 ppm as the feed-water hardness limit before RO stages.
Q8. What pH range is mentioned before RO/EDI treatment?
Answer: The risk assessment identifies a pH range of 6.5 to 8.5 and states that improper pH correction can affect RO membrane and EDI performance.
Q9. Why is SMBS dosing important?
Answer: SMBS dosing is used to control residual chlorine. If dosing is inadequate, chlorine may increase and adversely affect the RO membrane and EDI.
Q10. What is the purpose of antiscalant dosing?
Answer: Antiscalant dosing helps control scale formation on RO membranes. The system includes automatic dosing and pressure monitoring as control measures.
Q11. What conductivity limit is mentioned after RO Pass II?
Answer: The document states that RO Pass II conductivity should be not more than 20 µS.
Q12. Why is UV treatment critical in the purified water system?
Answer: UV treatment supports microbial control. If the UV lamp fails or is not replaced on time, microbial growth in the water may increase.
Q13. What controls are provided for the UV lamp?
Answer: UV lamp replacement is performed according to the defined SOP frequency, and lamp burning hours are monitored.
Q14. Why is proper circulation in the distribution loop important?
Answer: Inadequate circulation can increase microbial growth in the supply loop and near sampling points.
Q15. What return-loop velocity is specified in the document?
Answer: The return velocity is maintained at NLT 1.2 m/s or 4100 L/hour and is recorded according to the SOP.
Q16. How are dead legs controlled in the distribution system?
Answer: The document states that zero-dead-leg sampling points are provided at user points and that the distribution loop is maintained as a closed system with a slope of 1:100.
Q17. What may happen if a UF membrane does not work properly?
Answer: The microbial count may increase. Sanitization and pressure monitoring before and after the UF membrane are identified as control measures.
Q18. Why are purified water sampling points and frequencies important?
Answer: Defined sampling points and frequencies help track water quality at different user points and support investigation of failures.
Q19. How is microbial and chemical water quality monitored?
Answer: The document states that sampling and testing schedules are defined for different locations, the return sampling point is sampled daily, and quarterly and yearly trending is performed.
Q20. Why is preventive maintenance important for the water system?
Answer: Preventive maintenance helps verify equipment, sensors, pumps, distribution components, and overall system performance so routine failures and breakdowns can be minimized.
Q21. Which departments are involved in the risk assessment?
Answer: The document identifies Quality Assurance, Engineering, Production, Quality Control, and Store as responsible functions.
Q22. What is the ultimate objective of controlling these risks?
Answer: The objective is to maintain purified water within the required specification so that it can be safely used for pharmaceutical manufacturing and cleaning operations.